
Please note: there is also a MultiCharts version of this program. For information and downloads see below.
Creating a TradeStation EasyLanguage strategy can be a time consuming and expensive process. Having created a strategy you might then realize that it is not very profitable or has other unforeseen problems. Program 46 is designed to allow you to add text markers to a chart based on your own rules in order to generate dummy historical trades.
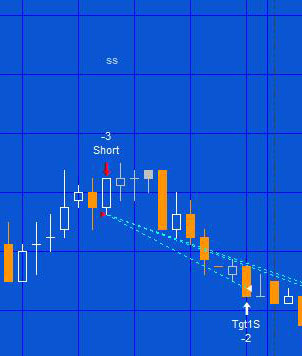
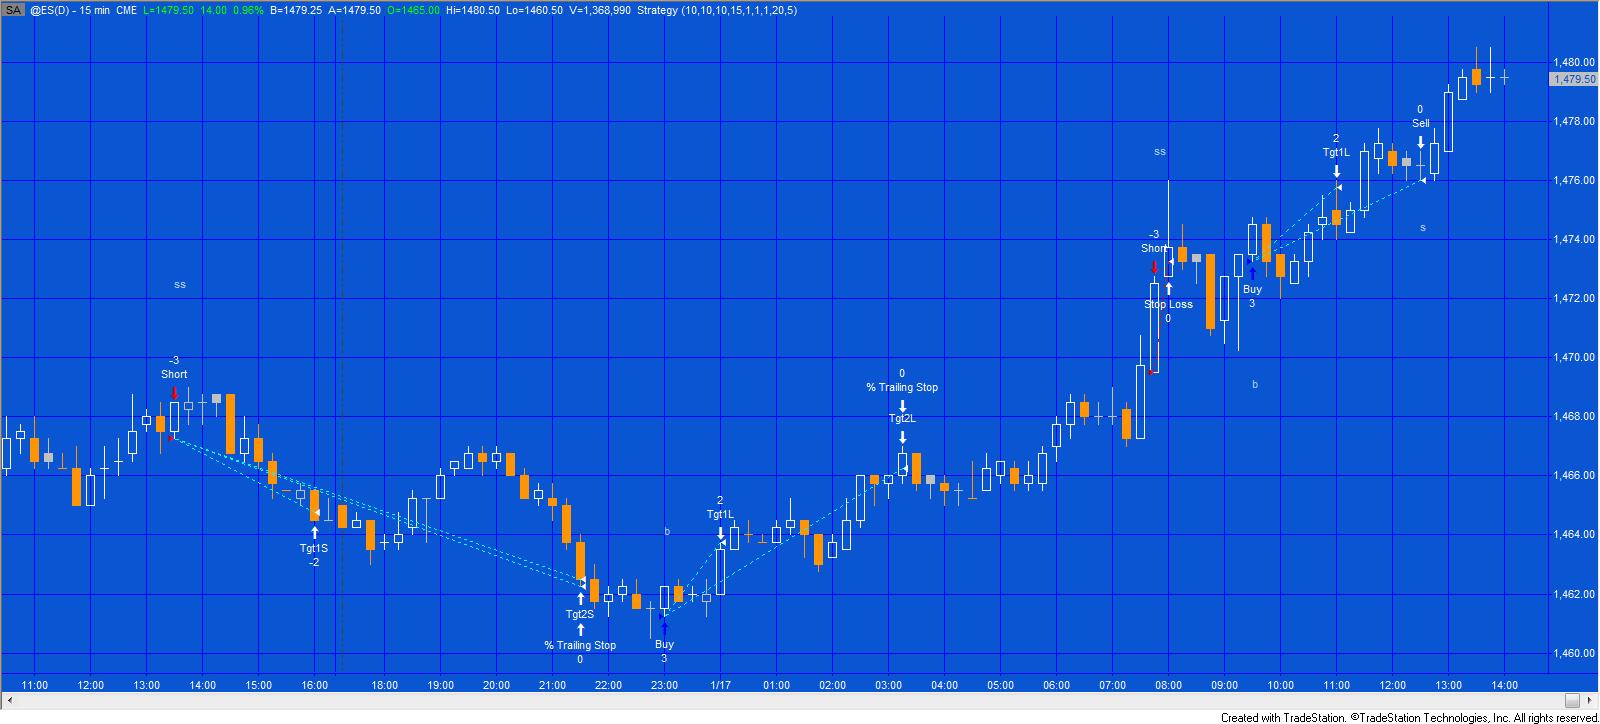
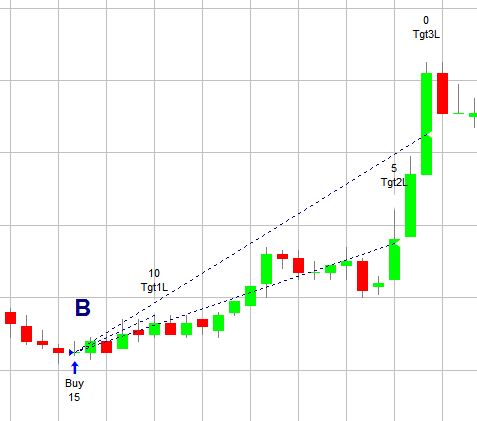
For example, to create an historical buy you would use the drawing tools to add a ‘B’ to the chart. It doesn’t matter where the text is located vertically or whether the letters are in caps or non-caps. It can even be placed on a sub-chart. Similarly to create an historical sell short trade you would enter ‘SS.’ The program uses ‘S’ for sell and ‘BC’ for buy to cover. Having switched the strategy on or refreshed the screen by pressing CTRL-R you then see the trades on the chart and can view the strategy performance report. The program has three built in targets, a stop input and trailing stop user inputs. I demonstrate the program in the video below.
The program works on minute, daily, weekly and monthly bar charts and it was created in TradeStation 9.1. It may be used with ‘Enable intra bar order generation and calculation’ set to true or false. The program uses TokenList functionality and consequently is incompatible with MultiCharts, however I have also created a MultiCharts version (see below or click here.)
The program could be used in conjunction with an indicator or showme study to test rules before building them into a strategy. For example, you could insert two moving averages and a stochastic indicator to the chart. If the averages crossed and stochastics were above or below a certain amount you could draw a ‘b’ for buy or ‘ss’ for sell short depending on your rules. Having gone through the entire chart and annotated it with text representing your trades and refreshed the screen, you could then view the strategy performance reports.
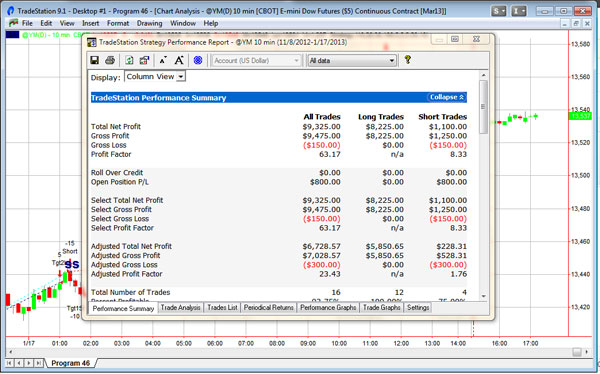
- Example performance report
Inputs
Tgt1( 100 ), // First target expressed number of ticks from entryprice
Tgt2( 100 ), // Second target initially equals first target plus Tgt2 ticks
Tgt3( 100 ), // Third target initially equals second target plus Tgt3 ticks
Stp( 100 ), // Places stop line initially Stp ticks from entry line
Cts1( 5 ), // Number of contracts bought or sold at the first target
Cts2( 5 ), // Number of contracts bought or sold at the second target
Cts3( 5 ), // Number of contracts bought or sold at the third target
FloorAmntTcks( 50 ), // Once price moves to this amount of profit (expressed as a number of ticks) the percent trail begins
Perc( 10 ); // Percentage of profit that strategy can lose once the trailing stop floor is reached
If you do not wish to use the target or stop functionality you could make the inputs very large or comment out this part of the program.
This program is available for immediate download for $59.95 by clicking the ‘add to cart’ button below. You may pay using PayPal or a credit card.
As usual, Gold Pass members get an additional 20% discount off all program and tutorial prices. If you are a Gold Pass member make sure you enter the special coupon code to get 20% discount off this price.
Video explanation of the strategy blueprint planner
Video part 2
In this second video about program 46 I explain how the strategy can be used with an indicator (or indicators). I also cover the ‘maximum bars study will reference’ setting and how the program can be optimized. In this particular case I look for a slow stochastic to cross below an overbought line to generate sell short trades and to cross above an oversold line to generate a buy trade.
This program is available for immediate download for $59.95 by clicking the ‘add to cart’ button below. You may pay using PayPal or a credit card.
As usual, Gold Pass members get an additional 20% discount off all program and tutorial prices. If you are a Gold Pass member make sure you enter the special coupon code to get 20% discount off these prices.
Program 46 | MultiCharts edition
The TradeStation version of the program uses the token list functionality that became available in TradeStation 9.0. As a result, it does not work in MultiCharts, however there is now a Multicharts version that uses a dynamic array instead of the token list.
This Multicharts version of the program is available for immediate download for $59.95 by clicking the ‘add to cart’ button below. You may pay using PayPal or a credit card.
As usual, Gold Pass members get an additional 20% discount off all program and tutorial prices. If you are a Gold Pass member make sure you enter the special coupon code to get 20% discount off this price.
Please note that any screen shots on this site are examples and are not meant to imply that any of these programs will generate profitable trades. THESE INDICATORS, SHOW ME STUDIES, STRATEGIES AND OTHER PROGRAMS HAVE BEEN INCLUDED SOLELY FOR EDUCATIONAL PURPOSES.
TO THE BEST OF MARKPLEX CORPORATION’S KNOWLEDGE, ALL OF THE INFORMATION ON THIS PAGE IS CORRECT, AND IT IS PROVIDED IN THE HOPE THAT IT WILL BE USEFUL. HOWEVER, MARKPLEX CORPORATION ASSUMES NO LIABILITY FOR ANY DAMAGES, DIRECT OR OTHERWISE, RESULTING FROM THE USE OF THIS INFORMATION AND/OR PROGRAM(S) DESCRIBED, AND NO WARRANTY IS MADE REGARDING ITS ACCURACY OR COMPLETENESS. USE OF THIS INFORMATION AND/OR PROGRAMS DESCRIBED IS AT YOUR OWN RISK.
ANY EASYLANGUAGE OR POWERLANGUAGE TRADING STRATEGIES, SIGNALS, STUDIES, INDICATORS, SHOWME STUDIES, PAINTBAR STUDIES, PROBABILITYMAP STUDIES, ACTIVITYBAR STUDIES, FUNCTIONS (AND PARTS THEREOF) AND ASSOCIATED TECHNIQUES REFERRED TO, INCLUDED IN OR ATTACHED TO THIS TUTORIAL OR PROGRAM DESCRIPTION ARE EXAMPLES ONLY, AND HAVE BEEN INCLUDED SOLELY FOR EDUCATIONAL PURPOSES. MARKPLEX CORPORATION. DOES NOT RECOMMEND THAT YOU USE ANY SUCH TRADING STRATEGIES, SIGNALS, STUDIES, INDICATORS, SHOWME STUDIES, PAINTBAR STUDIES, PROBABILITYMAP STUDIES, ACTIVITYBAR STUDIES, FUNCTIONS (OR ANY PARTS THEREOF) OR TECHNIQUES. THE USE OF ANY SUCH TRADING STRATEGIES, SIGNALS, STUDIES, INDICATORS, SHOWME STUDIES, PAINTBAR STUDIES, PROBABILITYMAP STUDIES, ACTIVITYBAR STUDIES, FUNCTIONS AND TECHNIQUES DOES NOT GUARANTEE THAT YOU WILL MAKE PROFITS, INCREASE PROFITS, OR MINIMIZE LOSSES.