See details of the updated version below
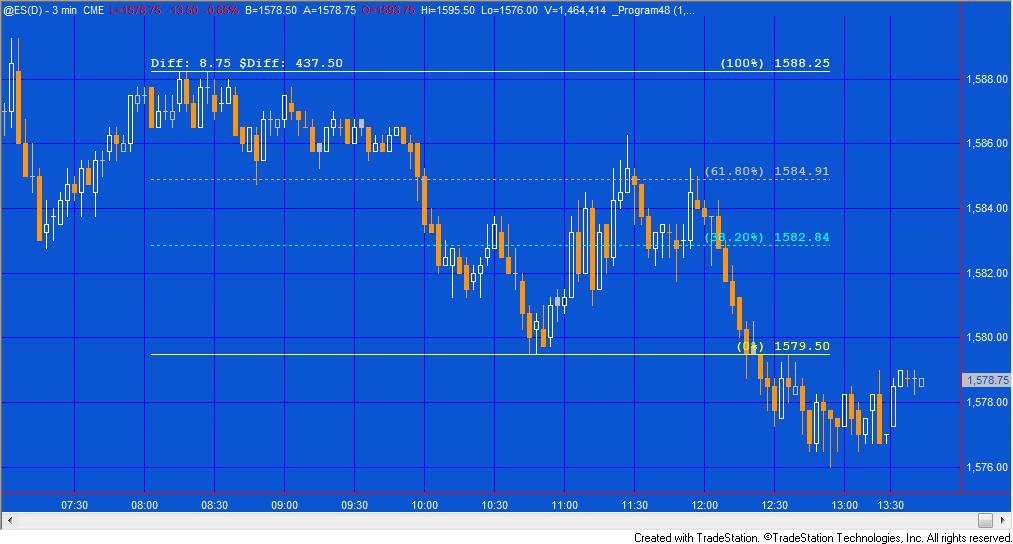
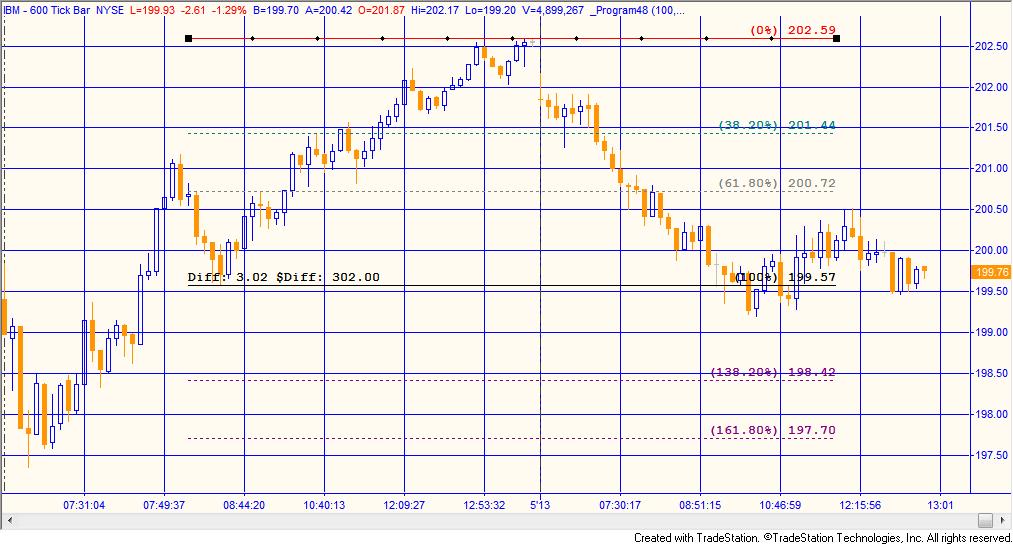
Program 48 draws two horizontal lines on a chart and fib retracement lines at 38.2%, 61.8%, 138.2% and 161.8%. The user may drag the top or bottom lines or ‘stretch’ them to the right or left. If they are moved or resized then the Fibonacci levels are adjusted accordingly. In addition the lines can be calculated from top to bottom or bottom to top, depending on a user input.
The tool also displays, as text above the top or bottom lines, the price difference between the two lines and that distance expressed in money terms (based on a user input number of shares, contracts or units). For currencies that are not denominated in the currency set for your TradeStation account, a conversion is made automatically. The program automatically calculates the correct number of decimal places and the lines will automatically be positioned on the nearest tick. For example, for @ES this means that a line can only be on a 1, 0.25, 0.5, or 0.75 increment

Program 48 was designed for TradeStation 9.1 and above. A different version for MultiCharts will be available in due course.

Inputs
LotSize( 1 ), // For futures and stocks this is the number of contracts or shares to calculate the difference between the two lines in terms of money value. For Forex this is the number of currency units in a lot.
origTopVal( GetAppInfo(aiLowestDispValue) + 0.75 *(GetAppInfo(aiHighestDispValue) – GetAppInfo(aiLowestDispValue)) ),
origBottomVal( GetAppInfo(aiLowestDispValue) + 0.25 * (GetAppInfo(aiHighestDispValue) – GetAppInfo(aiLowestDispValue)) ),
origLeftDate( JulianToDate( IntPortion( GetAppInfo( aiLeftDispDateTime ) + .25 * ( GetAppInfo( aiRightDispDateTime ) – GetAppInfo( aiLeftDispDateTime ) ) ) ) ),
origLeftTime( HoursFromDateTime( GetAppInfo( aiLeftDispDateTime ) + .25 * ( GetAppInfo( aiRightDispDateTime ) – GetAppInfo( aiLeftDispDateTime ) ) ) * 100 + MinutesFromDateTime( GetAppInfo( aiLeftDispDateTime ) + .25 * ( GetAppInfo( aiRightDispDateTime ) – GetAppInfo( aiLeftDispDateTime ) ) ) ),
origRightDate( JulianToDate( IntPortion( GetAppInfo( aiLeftDispDateTime ) + .75 * ( GetAppInfo( aiRightDispDateTime ) – GetAppInfo( aiLeftDispDateTime ) ) ) ) ),
origRightTime( HoursFromDateTime( GetAppInfo( aiLeftDispDateTime ) + .75 * ( GetAppInfo( aiRightDispDateTime ) – GetAppInfo( aiLeftDispDateTime ) ) ) * 100 + MinutesFromDateTime( GetAppInfo( aiLeftDispDateTime ) + .75 * ( GetAppInfo( aiRightDispDateTime ) – GetAppInfo( aiLeftDispDateTime ) ) ) ),
TopLineCol( Red ), // Color of top line
BottomLineCol( Yellow ), // Color of bottom line
FibCol382( Cyan ), // Color of 38.2% Fibonacci level
FibCol618( LightGray ), // Color of 61.8% Fibonacci level
FibCol1382( Magenta ), // Color of 138.2% Fibonacci level
FibCol1618( Magenta ), // Color of 161.8% Fibonacci level
HiLo( True ) // If true, retracements are calculated from top down, if false, from bottom up
Note: The program tries to place the lines, initially, in the center of the chart from where the user can move them around by dragging with a cursor. The calculations in the user inputs:
- origTopVal,
- origBottomVal,
- origLeftDate,
- origLeftTime,
- origRightDate,
- and origRightTime
create the original positioning. This works well for continuous contracts but does not work so well for non-continuous contracts. In this case the user can replace the calculations with appropriate input values, i.e. a left date and time that can be seen on the chart and a right date and time that can be seen on the chart.
If you change symbol then the easiest thing to do is to turn the status of the show me study off, and then back on again.
Partial data situation
When a chart indicates that there is ‘partial data’ i.e. ‘PD” is visible in the top left hand corner of the chart, the program calculates the initial positions correctly, however when the chart automatically refreshes, the lines may appear to disappear. To remedy this change the status of program 48 to off and then back to on.
An explanation of the information line syntax
Diff = TopVal - BottomVal;

If HiLo then
Begin
Str = "Diff: " + NumToStr( Diff, DecPlaces ) + " $Diff: " + NumToStr( Diff * BigPointValue * LotSize * ProfitCF , DecPlaces );
Text_SetLocation( TopValTxt2, LeftDate, LeftTime, TopVal ) ;
Text_SetString( TopValTxt2, Str );
End

Else
Begin
Str = "Diff: " + NumToStr( Diff, DecPlaces ) + " $Diff: " + NumToStr( Diff * BigPointValue * LotSize * ProfitCF , DecPlaces );
Text_SetLocation( TopValTxt2, LeftDate, LeftTime, BottomVal ) ;
Text_SetString( TopValTxt2, Str );
End;
This code is repeated in several places throughout the program, so if you do decide to make any changes make sure that you repeat them in the appropriate places.
The part of the code that actually creates the information text is:
Str = "Diff: " + NumToStr( Diff, DecPlaces ) + " $Diff: " + NumToStr( Diff * BigPointValue * LotSize * ProfitCF , DecPlaces );
Diff is the difference between the level of the top line and the bottom line. If you wanted to add another value, say at the TopVal (the level of the top line) plus the Diff then the syntax would become:
Str = "Diff: " + NumToStr( Diff, DecPlaces ) + " $Diff: " + NumToStr( Diff * BigPointValue * LotSize * ProfitCF , DecPlaces ) + " More: " + NumToStr( TopVal + Diff, DecPlaces );
Notice that the syntax converts the numbers into strings to a specified number of decimal places (DecPlaces). DecPlaces is automatically calculated by the program.
Notice that the syntax converts the numbers into strings to a specified number of decimal places (DecPlaces). DecPlaces is automatically calculated by the program.
Please note that any screen shots on this site are examples and are not meant to imply that any of these programs will generate profitable trades. THESE INDICATORS, SHOW ME STUDIES, STRATEGIES AND OTHER PROGRAMS HAVE BEEN INCLUDED SOLELY FOR EDUCATIONAL PURPOSES.
Updated version (2024)
A new version of program 48 (Program48v1.1) is now included with the download. The original program attempted to place the initial lines horizontally in the center of the visible window by doing a calculation using date and time. This was challenging in some instances (for example when there was a weekend in the time series on the screen)
Instead, the updated version uses bar numbers to place the initial lines more accurately. To achieve this, the initial lines and text is drawn in an arboitrary position in a Once statement. Later on, on last bar on chart (when the bar numbers of the last bar on chart, and the bar numbers at either end of the visible window, are known) the text objects are repositioned and the start and end of the lines are reset.
The new program also adds additional levels at 23.6% and 50%. This was achieved by increasing the size of the arrays and adding new inputs for colors.
Inputs for the updated program
Comparing program 48 with the updated version
An unprotected version of program 48 (original version) together with program 48 (updated version) are available for download for $39.95
As usual, Gold Pass members get an additional 20% discount off all program and tutorial prices. If you are a Gold Pass member make sure you enter the special coupon code to get 20% discount off these prices. You can find the coupon code on the Gold Pass page.
TO THE BEST OF MARKPLEX CORPORATION’S KNOWLEDGE, ALL OF THE INFORMATION ON THIS PAGE IS CORRECT, AND IT IS PROVIDED IN THE HOPE THAT IT WILL BE USEFUL. HOWEVER, MARKPLEX CORPORATION ASSUMES NO LIABILITY FOR ANY DAMAGES, DIRECT OR OTHERWISE, RESULTING FROM THE USE OF THIS INFORMATION AND/OR PROGRAM(S) DESCRIBED, AND NO WARRANTY IS MADE REGARDING ITS ACCURACY OR COMPLETENESS. USE OF THIS INFORMATION AND/OR PROGRAMS DESCRIBED IS AT YOUR OWN RISK.
ANY EASYLANGUAGE OR POWERLANGUAGE TRADING STRATEGIES, SIGNALS, STUDIES, INDICATORS, SHOWME STUDIES, PAINTBAR STUDIES, PROBABILITYMAP STUDIES, ACTIVITYBAR STUDIES, FUNCTIONS (AND PARTS THEREOF) AND ASSOCIATED TECHNIQUES REFERRED TO, INCLUDED IN OR ATTACHED TO THIS TUTORIAL OR PROGRAM DESCRIPTION ARE EXAMPLES ONLY, AND HAVE BEEN INCLUDED SOLELY FOR EDUCATIONAL PURPOSES. MARKPLEX CORPORATION. DOES NOT RECOMMEND THAT YOU USE ANY SUCH TRADING STRATEGIES, SIGNALS, STUDIES, INDICATORS, SHOWME STUDIES, PAINTBAR STUDIES, PROBABILITYMAP STUDIES, ACTIVITYBAR STUDIES, FUNCTIONS (OR ANY PARTS THEREOF) OR TECHNIQUES. THE USE OF ANY SUCH TRADING STRATEGIES, SIGNALS, STUDIES, INDICATORS, SHOWME STUDIES, PAINTBAR STUDIES, PROBABILITYMAP STUDIES, ACTIVITYBAR STUDIES, FUNCTIONS AND TECHNIQUES DOES NOT GUARANTEE THAT YOU WILL MAKE PROFITS, INCREASE PROFITS, OR MINIMIZE LOSSES.

