
Markplex P & F simulator for bar charts
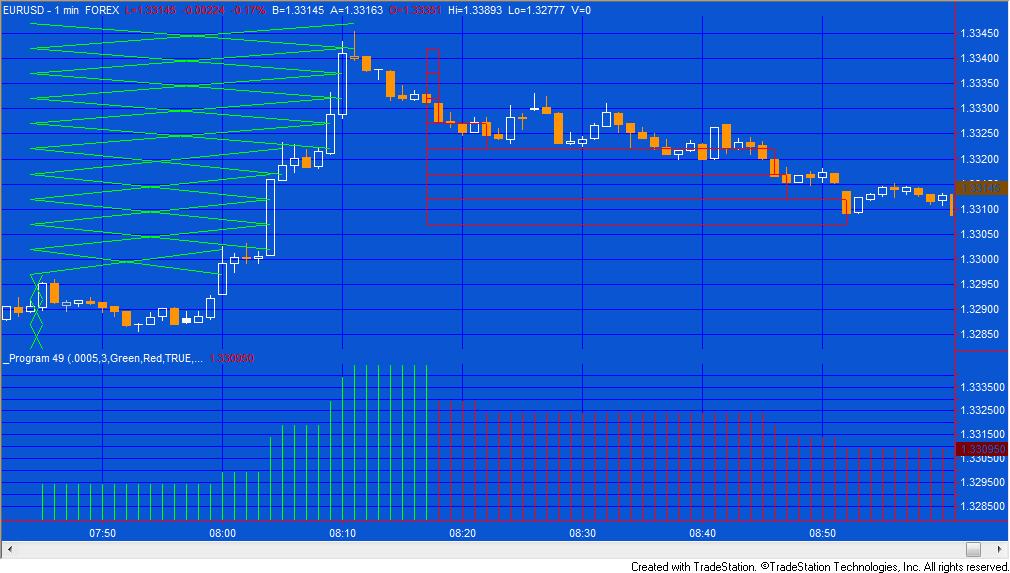
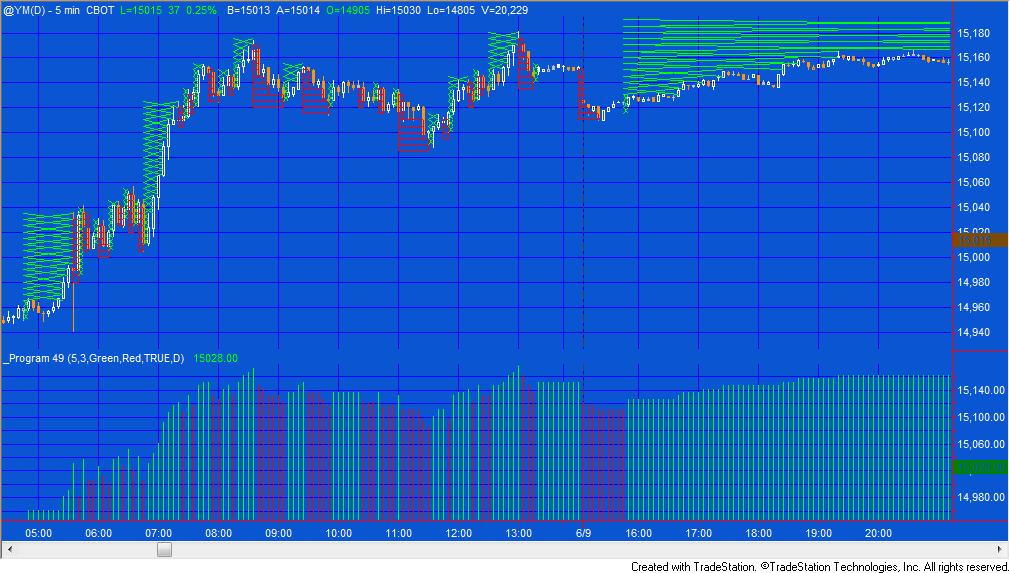
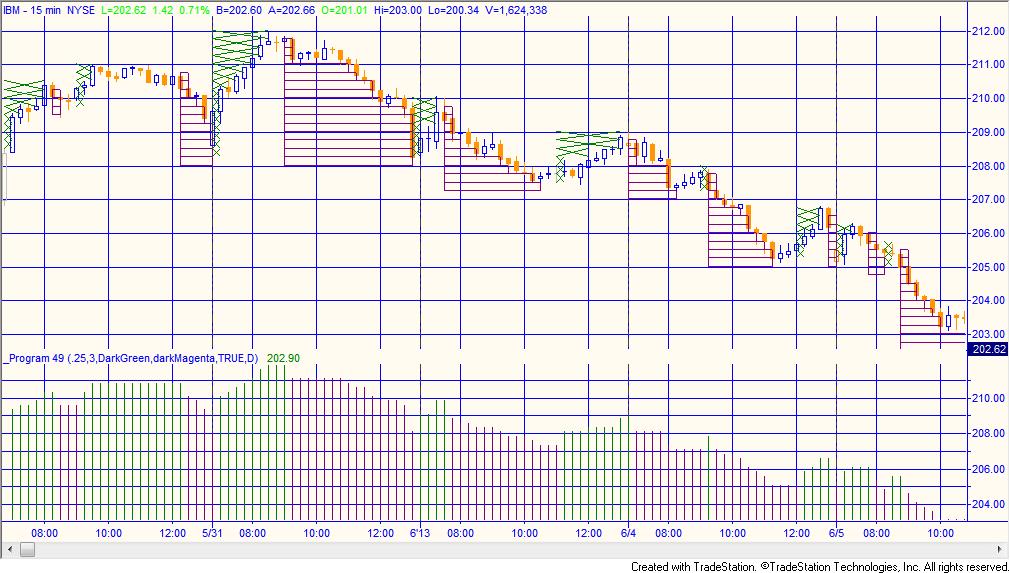
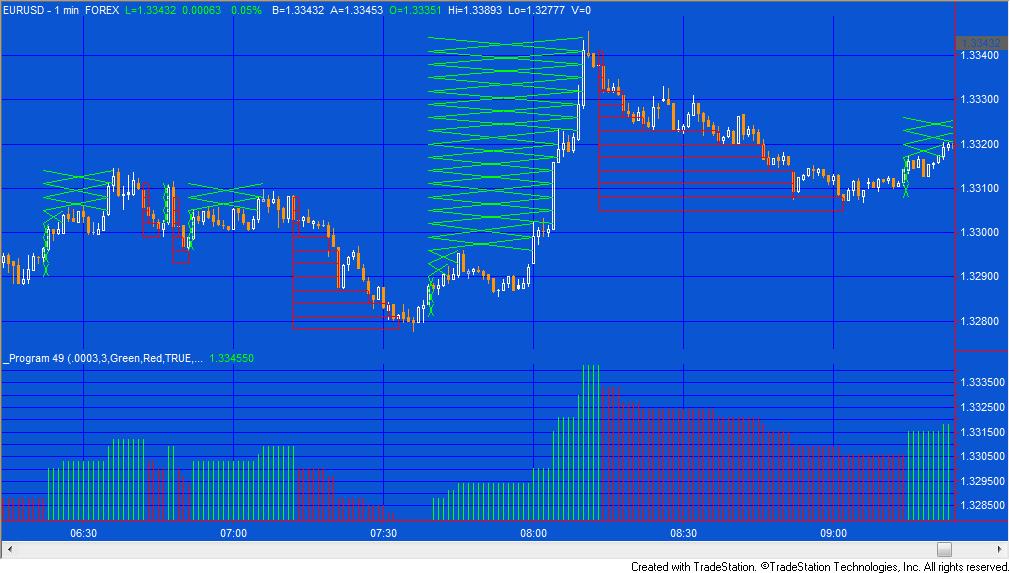
Program 49–Markplex Point & Figure Simulator is a TradeStation EasyLanguage indicator designed to ‘overlay’ point & figure (P&F) boxes on a regular chart. The purpose in creating it was to be able to see the ‘pure’ filtered price movement that can be seen on a point and figure chart on a regular chart.
Click on images to enlarge them.
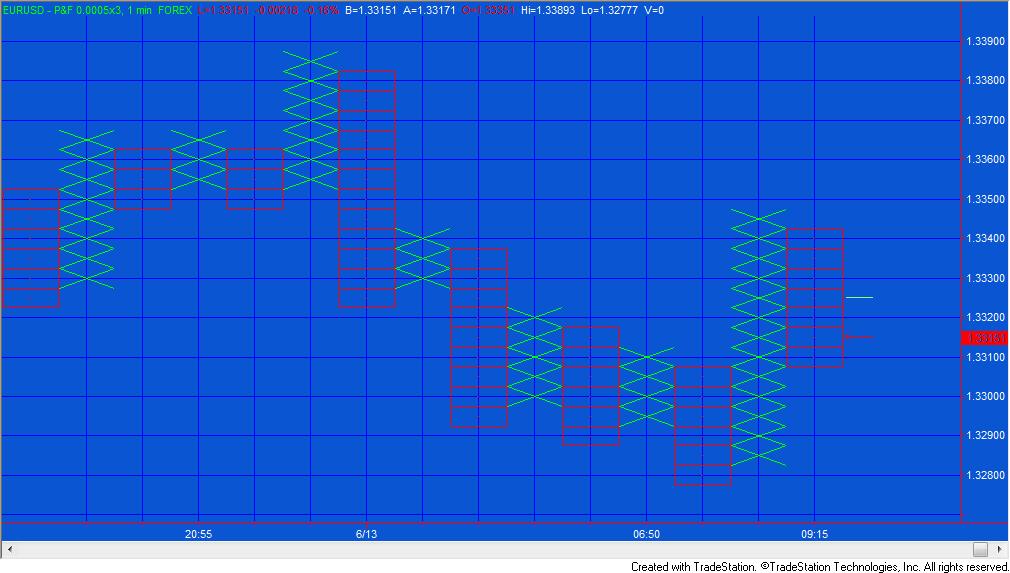
Point and figure charts are focused purely on price action, with time being irrelevant. Price movements are filtered as a P&F chart removes some of the price ‘noise.’ For rising prices crosses are drawn, one above another. For falling prices circles or boxes are drawn one below the other.
Point and figure charts can use two different pricing methods: the high-low pricing method or the close method. In each case only one price is used to determine whether a new box or a reversal is drawn. With the ‘close’ method, this is always the closing price. With the ‘high-low’ method in a rising column the high is used if a new cross can be drawn and the low is ignored. If a new cross cannot be drawn then low is checked to see if a reversal has been triggered. If neither a new box nor a reversal are triggered then nothing is drawn. Similarly with the ‘high-low’ method in a falling column the low is used if a new box could be drawn and the high is ignored. If a new box cannot be drawn then the high is checked to see if a reversal has been triggered. If neither a new box nor a reversal are triggered then nothing is drawn.
The Markplex P&F displays the creation of new boxes or crosses and reversals slightly differently than the TradeStation ‘native’ point and figure chart. Let’s assume we have a bar of rising crosses. If price exceeds a user input amount from the middle of the previous cross, a new cross is drawn in real time. This process continues as price rises and potentially more crosses are drawn as the bar develops. However, assume the price were to fall instead, without an upward cross being formed. Even though price may have gone down by the reversal amount (in this program this is equal to the PFBoxSize multiplied by Reversal), if the bar has NOT ended yet, there is still the possibility of a new upward cross being drawn, hence the program waits until the end of the bar to draw the reversal bars. This is slightly different from the behavior of the TradeStation P&F chart where reversal bars are shown and then will disappear of the underlying end of bar has not been reached and the price starts to rise again.
Also, with the close ‘method’ the calculation is always made at the end of the bar.
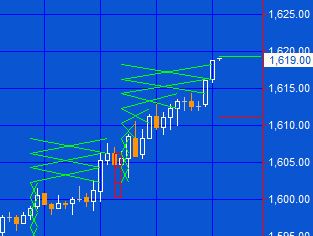
Another different feature of program 49 is the drawing of horizontal lines at which a new cross or box would be drawn or at which a reversal would occur. In the image to the right (i.e. a rising column of x’s) the green line is the price that must be reached for a new cross to be drawn. The red line is the level price would have to fall to to trigger a reversal (provided no new upward crosses had been drawn). Similarly, for a falling column of boxes, the red line is the price that must be reached for a new box to be drawn. The green line is the level price would have to rise to to trigger a reversal (provided no new downward boxes had been drawn).
Program 49 was designed for TradeStation 9.1 (release 18). It works on intraday daily, weekly and monthly charts.
An unprotected version of program 49 is available for download for $94.95. Please review the _StartDate explanation and Program management sections below.
I have recorded a short video that demonstrates how to use the Markplex.com shopping cart to immediately download a program and import it into TradeStation.
Gold Pass members get an additional 20% discount off all program and tutorial prices. If you are a Gold Pass member make sure you enter the special coupon code to get 20% discount off these prices. You can find the coupon code on the Gold Pass page.
Inputs
PFBoxSize( .00002 ), // Size of box
Reversal( 3 ), // Number of boxes required for a reversal
UpColor( Green ), // Color of up ‘crosses’
DnColor( Red ), // Color of down ‘zeros’
HiLoMethod( TRUE ), // If TRUE program uses the High – Low method, otherwise the close method
_StartDate( CalcDate( CurrentDate, -5 ) ) ; // Restricts the number of days that boxes are drawn for
_StartDate explanation
Each box drawn on the chart consists of 4 lines and each cross consists of 2 lines, consequently the program attempts to draw and manage a, potentially, huge number of drawing objects. This can slow the program down, particularly if you have a large number of bars loaded, have a very small value for PFBoxSize, or have a number of charts open.
TradeStation cannot only cope with so many drawing objects before the program appears to grind to a halt. In order to reduce the memory and processing acquirement of the program, _StartDate allows you to control when the drawing objects start appearing. If you don’t want any drawing objects appearing change _StartDate to zero. The default input is CalcDate( CurrentDate, -5 ) which means that the program will allow the drawing objects to be drawn for the last 5 days (including the current date).
If you want the boxes or crosses drawn from the beginning of the chart then set _StartDate to D.
Alternatively, if you wish to enter a specific date it must be entered in EasyLanguage format. For example, June 14, 2013 in EasyLanguage format is 1130614. May 1, 2012 would be expressed as 1120501.
Irrespective of whether the boxes are drawn or not, the plot still occurs.
Program management
- Once you have imported the program and associated functions into your system, open a chart. I suggest minimizing the number of the days back of data on the chart initially.
- Insert the indicator (N.B. The indicator begins with an underscore: _Program49)
- Once inserted, click Format – Analysis Techniques and double click on _Program49. Click the input tab.
- Adjust the CalcDate input. You might wish to start by entering zero.
- Review your chart and then try entering ( CurrentDate, -5 )
- If you require additional days back, increase the integer in the expression: ( CurrentDate, -5 )
Program 49 was designed for TradeStation 9.1 (release 18). It works on intraday daily, weekly and monthly charts.
An unprotected version of program 49 is available for download for $94.95
A special discounted bundle of programs 49 and 50 is available for $125.95. This is more than a 25% discount off the cost of buying the two programs separately.
I have recorded a short video that demonstrates how to use the Markplex.com shopping cart to immediately download a program and import it into TradeStation.
Gold Pass members get an additional 20% discount off all program and tutorial prices. If you are a Gold Pass member make sure you enter the special coupon code to get 20% discount off these prices. You can find the coupon code on the Gold Pass page.
Video of program 49
Program 49 was designed for TradeStation 9.1 and above. It works on intraday daily, weekly and monthly charts.
An unprotected version of program 49 is available for download for $94.95. Please review the _StartDate explanation and Program management sections above.
A special discounted bundle of programs 49 and 50 is available for $125.95. This is more than a 25% discount off the cost of buying the two programs separately.
I have recorded a short video that demonstrates how to use the Markplex.com shopping cart to immediately download a program and import it into TradeStation.
Gold Pass members get an additional 20% discount off all program and tutorial prices. If you are a Gold Pass member make sure you enter the special coupon code to get 20% discount off these prices. You can find the coupon code on the Gold Pass page.
Please note that any screen shots on this site are examples and are not meant to imply that any of these programs will generate profitable trades. THESE INDICATORS, SHOW ME STUDIES, STRATEGIES AND OTHER PROGRAMS HAVE BEEN INCLUDED SOLELY FOR EDUCATIONAL PURPOSES.
TO THE BEST OF MARKPLEX CORPORATION’S KNOWLEDGE, ALL OF THE INFORMATION ON THIS PAGE IS CORRECT, AND IT IS PROVIDED IN THE HOPE THAT IT WILL BE USEFUL. HOWEVER, MARKPLEX CORPORATION ASSUMES NO LIABILITY FOR ANY DAMAGES, DIRECT OR OTHERWISE, RESULTING FROM THE USE OF THIS INFORMATION AND/OR PROGRAM(S) DESCRIBED, AND NO WARRANTY IS MADE REGARDING ITS ACCURACY OR COMPLETENESS. USE OF THIS INFORMATION AND/OR PROGRAMS DESCRIBED IS AT YOUR OWN RISK.
ANY EASYLANGUAGE OR POWERLANGUAGE TRADING STRATEGIES, SIGNALS, STUDIES, INDICATORS, SHOWME STUDIES, PAINTBAR STUDIES, PROBABILITYMAP STUDIES, ACTIVITYBAR STUDIES, FUNCTIONS (AND PARTS THEREOF) AND ASSOCIATED TECHNIQUES REFERRED TO, INCLUDED IN OR ATTACHED TO THIS TUTORIAL OR PROGRAM DESCRIPTION ARE EXAMPLES ONLY, AND HAVE BEEN INCLUDED SOLELY FOR EDUCATIONAL PURPOSES. MARKPLEX CORPORATION. DOES NOT RECOMMEND THAT YOU USE ANY SUCH TRADING STRATEGIES, SIGNALS, STUDIES, INDICATORS, SHOWME STUDIES, PAINTBAR STUDIES, PROBABILITYMAP STUDIES, ACTIVITYBAR STUDIES, FUNCTIONS (OR ANY PARTS THEREOF) OR TECHNIQUES. THE USE OF ANY SUCH TRADING STRATEGIES, SIGNALS, STUDIES, INDICATORS, SHOWME STUDIES, PAINTBAR STUDIES, PROBABILITYMAP STUDIES, ACTIVITYBAR STUDIES, FUNCTIONS AND TECHNIQUES DOES NOT GUARANTEE THAT YOU WILL MAKE PROFITS, INCREASE PROFITS, OR MINIMIZE LOSSES.