
Markplex P & F turning points and support and resistance
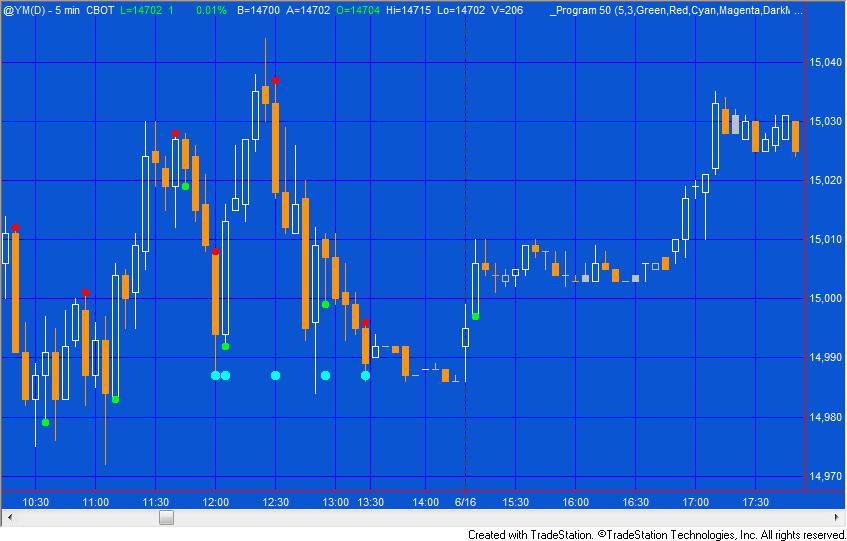
Program 50 | Point and figure turning points and support and resistance is a TradeStation EasyLanguage show-me study designed to show point and figure behavior on regular bar charts. Program 50 is similar to program 49, however, rather than drawing crosses and boxes on a chart, program 50 plots a dot on the chart when a newline of Xs would start to be drawn on a point and figure chart and another dot when price changes direction. A user input determines the color of the dots.
Point and figure (P&F) charts are focused purely on price action, with time being irrelevant. Price movements are filtered as a P&F chart removes some of the price ‘noise.’ For rising prices crosses are drawn, one above another. For falling prices circles or boxes are drawn one below the other.
Support and resistance
The program also analyzes the point and figure to display the equivalent of support and resistance levels.
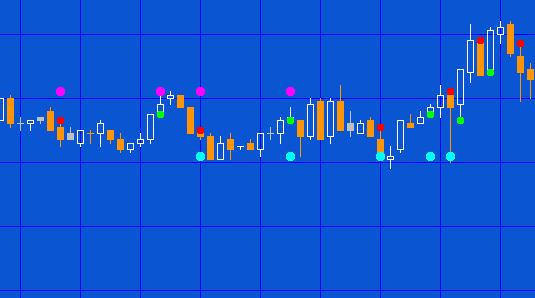
On a point and figure chart support levels can be drawn when several columns of ‘Os’ have the same price at the bottom of the column. Resistance levels can be drawn when several columns of ‘Xs” have the same price at the top of the columns. Program 50 provides user inputs for the number of columns required to confirm a pattern. The patterns are displayed using show-me plots. The color of the plots are determined by user inputs. Since the show me columns may be ‘stretched’ horizontally to take into account the time element of a regular chart, the horizontal support and resistance dots may not appear on adjacent bars. an example of this can be seen in the image above where the potential support pattern is shown by cyan dots.
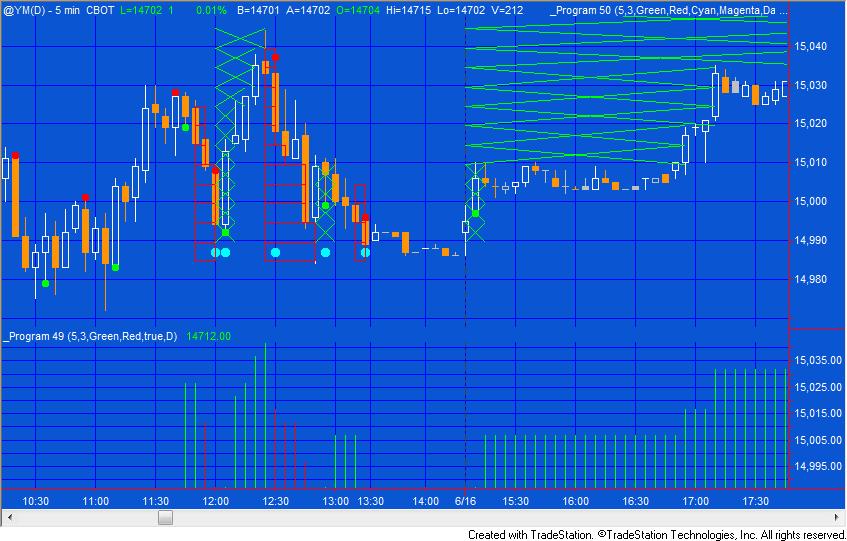
Support lines that slope upward and resistance lines that slope downwards are also highlighted by program 50. On a regular point and figure chart these patterns occur when the point and figure ‘building blocks’ slope upwards at a 45 degree angle. Because of the time element of a regular chart the equivalent program 50 patterns may not slope at a 45 degree angle, however they may be indicative of support or resistance.
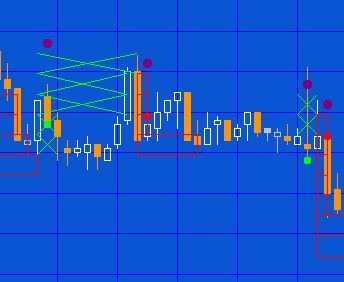
The following image shows program 49 and program 50 applied to a 5 minute @YM chart. I have included 49 to display the boxes and crosses which makes it easier to understand what is going on in the chart. To run program 50 it is NOT necessary to own or use program 49. The resistance pattern is displayed using dark magenta dots (the color of the dots can be set by a user input). Even though the angle of the dots is clearly not at a 45 degree angle you will notice the stepping effect.
Chart formation and reversals
Point and figure charts can use two different pricing methods: the high-low pricing method or the close method. In each case only one price is used to determine whether a new ‘virtual’ box or cross, or a reversal is drawn. With the ‘close’ method, this is always the closing price. With the ‘high-low’ method in a rising column the high is used if a new cross can be drawn and the low is ignored. If a new cross cannot be drawn then low is checked to see if a reversal has been triggered. If neither a new box nor a reversal are triggered then nothing is drawn. Similarly with the ‘high-low’ method in a falling column the low is used if a new virtual box could be drawn and the high is ignored. If a new virtual box cannot be drawn then the high is checked to see if a reversal has been triggered. If neither a new box nor a reversal are triggered then nothing is drawn.
Program 50 does not draw the crosses and boxes like program 49, but it uses the same methodology for calculating reversals. Let’s assume we have a bar of rising ‘imaginary’ crosses. If price exceeds a user input amount from the middle of the previous cross, a new cross is drawn in real time. This process continues as price rises and potentially more crosses are drawn as the bar develops. However, assume the price were to fall instead, without an upward cross being formed. Even though price may have gone down by the reversal amount (in this program this is equal to the PFBoxSize multiplied by Reversal), if the bar has NOT ended yet, there is still the possibility of a new upward cross being drawn, hence the program waits until the end of the bar to draw the reversal bars. This is slightly different from the behavior of the TradeStation P&F chart where reversal bars are shown and then will disappear of the underlying end of bar has not been reached and the price starts to rise again.
Also, with the close ‘method’ the calculation is always made at the end of the bar.
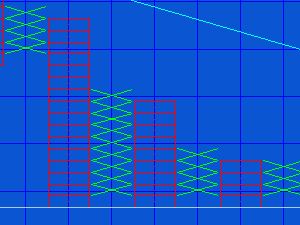
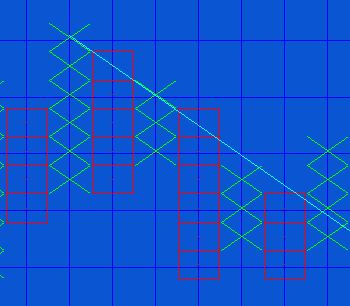
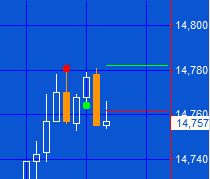 Another different feature of program 50 is the drawing of horizontal lines at which a new cross or box would be drawn or at which a reversal would occur. In the image to the right (i.e. a rising column of x’s) the green line is the price that must be reached for a new ‘virtual’ cross to be drawn. The red line is the level price would have to fall to to trigger a reversal (provided no new upward crosses had been drawn) and hence a dot plotted on that bar. Similarly, for a falling column of boxes, the red line is the price that must be reached for a new ‘virtual’ box to be drawn. The green line is the level price would have to rise to to trigger a reversal (provided no new downward virtual boxes had been drawn).
Program 50 was designed for TradeStation 9.1. It works on intraday, daily, weekly and monthly charts.
An unprotected version of program 50 is available for download for $74.95.
A special discounted bundle of programs 49 and 50 is available for $125.95. This is more than a 25% discount off the cost of buying the two programs separately.
I have recorded a short video that demonstrates how to use the Markplex.com shopping cart to immediately download a program and import it into TradeStation.
Gold Pass members get an additional 20% discount off all program and tutorial prices. If you are a Gold Pass member make sure you enter the special coupon code to get 20% discount off these prices. You can find the coupon code on the Gold Pass page.
Inputs
PFBoxSize( 20 ), // Size of box
Reversal( 3 ), // Number of boxes required for a reversal
UpColor( Green ), // Color of show me plot when direction changes to up
DnColor( Red ), // Color of show me plot when direction changes to down
RevUpColor( Cyan ), // Color if multiple bottoms found
RevDnColor( Magenta ), // Color if multiple tops found
ResColor( DarkMagenta ), // Used to plot downward sloping resistance lines
SupColor( DarkCyan ), // Used to plot upward sloping support lines
HiLoMethod( TRUE ), // If TRUE program uses the High – Low method, otherwise the close method
NumLos( 3 ), // The Number of lows required to highlight multiple equal bottoms
NumHis( 3 ), // The number of highs required to highlight multiple equal tops
NumRes( 2 ), // The number of highs required to draw a resistance plot
NumSup( 2 ); // The number of lows required to draw a support plot
Video of program 50
Program 50 was designed for TradeStation 9.1. It works on intraday, daily, weekly and monthly charts.
An unprotected version of program 50 is available for download for $74.95.
A special discounted bundle of programs 49 and 50 is available for $125.95. This is more than a 25% discount off the cost of buying the two programs separately.
I have recorded a short video that demonstrates how to use the Markplex.com shopping cart to immediately download a program and import it into TradeStation.
Gold Pass members get an additional 20% discount off all program and tutorial prices. If you are a Gold Pass member make sure you enter the special coupon code to get 20% discount off these prices. You can find the coupon code on the Gold Pass page.
Please note that any screen shots on this site are examples and are not meant to imply that any of these programs will generate profitable trades. THESE INDICATORS, SHOW ME STUDIES, STRATEGIES AND OTHER PROGRAMS HAVE BEEN INCLUDED SOLELY FOR EDUCATIONAL PURPOSES.
TO THE BEST OF MARKPLEX CORPORATION’S KNOWLEDGE, ALL OF THE INFORMATION ON THIS PAGE IS CORRECT, AND IT IS PROVIDED IN THE HOPE THAT IT WILL BE USEFUL. HOWEVER, MARKPLEX CORPORATION ASSUMES NO LIABILITY FOR ANY DAMAGES, DIRECT OR OTHERWISE, RESULTING FROM THE USE OF THIS INFORMATION AND/OR PROGRAM(S) DESCRIBED, AND NO WARRANTY IS MADE REGARDING ITS ACCURACY OR COMPLETENESS. USE OF THIS INFORMATION AND/OR PROGRAMS DESCRIBED IS AT YOUR OWN RISK.
ANY EASYLANGUAGE OR POWERLANGUAGE TRADING STRATEGIES, SIGNALS, STUDIES, INDICATORS, SHOWME STUDIES, PAINTBAR STUDIES, PROBABILITYMAP STUDIES, ACTIVITYBAR STUDIES, FUNCTIONS (AND PARTS THEREOF) AND ASSOCIATED TECHNIQUES REFERRED TO, INCLUDED IN OR ATTACHED TO THIS TUTORIAL OR PROGRAM DESCRIPTION ARE EXAMPLES ONLY, AND HAVE BEEN INCLUDED SOLELY FOR EDUCATIONAL PURPOSES. MARKPLEX CORPORATION. DOES NOT RECOMMEND THAT YOU USE ANY SUCH TRADING STRATEGIES, SIGNALS, STUDIES, INDICATORS, SHOWME STUDIES, PAINTBAR STUDIES, PROBABILITYMAP STUDIES, ACTIVITYBAR STUDIES, FUNCTIONS (OR ANY PARTS THEREOF) OR TECHNIQUES. THE USE OF ANY SUCH TRADING STRATEGIES, SIGNALS, STUDIES, INDICATORS, SHOWME STUDIES, PAINTBAR STUDIES, PROBABILITYMAP STUDIES, ACTIVITYBAR STUDIES, FUNCTIONS AND TECHNIQUES DOES NOT GUARANTEE THAT YOU WILL MAKE PROFITS, INCREASE PROFITS, OR MINIMIZE LOSSES.