
Markplex modified Renko charting
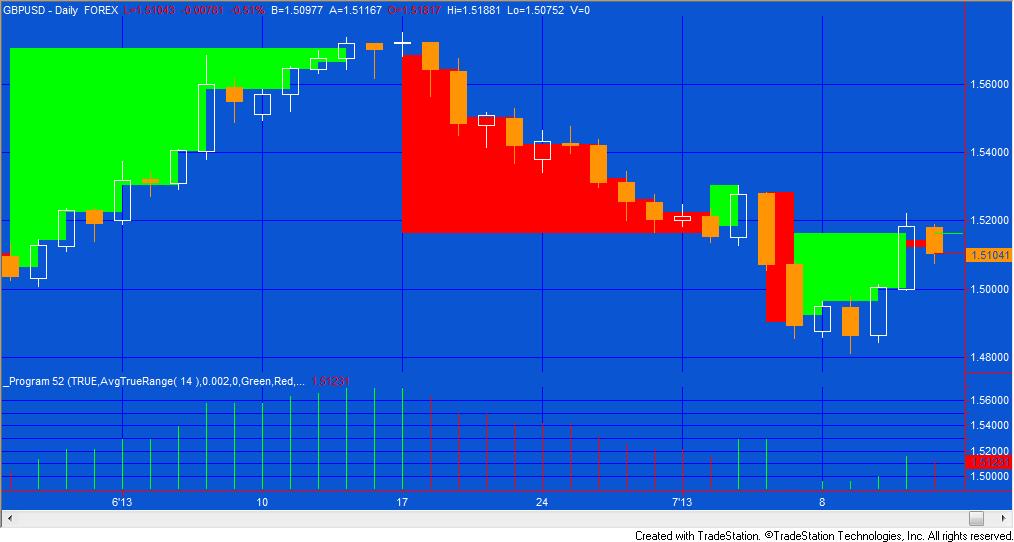
Program 52 | Markplex modified Renko charting is a TradeStation EasyLanguage indicator designed to draw modified Renko-like boxes on a regular bar chart. Reversals are drawn when a modified box moves one box in a new direction (according to the rules explained below). This program also allows the user to set up a fixed modified Renko box size or one that varies depending on the average true range. If you choose a variable box size, the default setting is: AvgTrueRange( 14 ).
Since normal Renko boxes do not have a time element, program 52 ‘stretches’ boxes to accommodate the regular chart.
If you are interested in using the new drawing objects classes to draw rectangles, I have included some additional resources for Gold Pass members, including a program that can be copied and pasted. The information may be found at the bottom of this page.
Program 52 is available for immediate download (including a PDF user guide) for $129.95 here:
The program was developed for TradeStation 9.1 and above. Unfortunately the program does not work with MultiCharts.
Calculation methodologies
Renko charts are normally created using tick data. Since this program uses the underlying bar data, it operates in a slightly different way. The user has the option of using the high-low methodology or the close methodology. In each case only one price is used to determine whether a new ‘virtual’ box is drawn.
High-low and close methodologies
High-low methodology
With the high–low methodology, when the direction is upward, new boxes are added in real time when the high of a bar is greater than or equal to the top of the last modified Renko box plus the modified Renko box size. This is demonstrated in the first video in this section. If at least one new up box is drawn then there cannot be a reversal for that bar. If the direction is upward but no upward box can be drawn for a specific bar and, at the end of the bar, the low of the bar is less than or equal to the bottom of current modified Renko box less the box size, then a reversal has occurred and a new downward box is drawn. This is demonstrated in the second short video in this section.
When the direction is downward, new boxes are added in real time when the low of a bar is less than or equal to the bottom of the last Renko box less the modified Renko box size. If at least one new down box is drawn then there cannot be an upward reversal for that bar. If the direction is down but no downward box can be drawn for a specific bar and, at the end of the bar, the high of the bar is greater than or equal to the top of the current modified Renko box plus the box size, then a reversal has occurred and a new upward box is drawn.
If neither a new box nor a reversal are triggered then nothing is drawn.
Close methodology
With the close methodology, when the direction is upward, new boxes are added at the close of the underlying bar when the close of the bar is greater than or equal to the top of the last Renko box to be drawn plus the modified Renko box size. If at least one new up box is drawn then there cannot be a reversal for that bar. If the direction is upward but no upward box can be drawn for a specific bar and, at the end of the bar, the close of the bar is less than or equal to the bottom of current modified Renko box less the box size, then a reversal has occurred and a new downward box is drawn.
When the direction is downward, new boxes are added at the close of the underlying bar when the close of a bar is less than or equal to the bottom of the last Renko box to be drawn less the modified Renko box size. If at least one new down box is drawn then there cannot be a reversal for that bar. If the direction is down but no downward box can be drawn for a specific bar and, at the end of the bar, the close of the bar is greater than or equal to the top of the current modified Renko box plus the box size, then a reversal has occurred and a new upward box is drawn.
If neither a new box nor a reversal are triggered then nothing is drawn.
Support and resistance
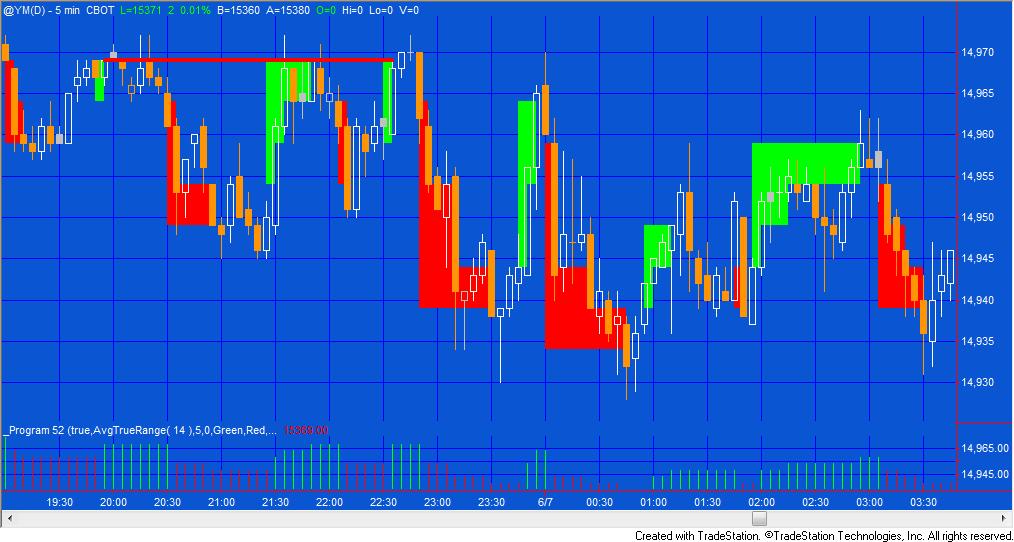
Program 52 also analyzes the modified Renko boxes to display the equivalent of support and resistance levels.
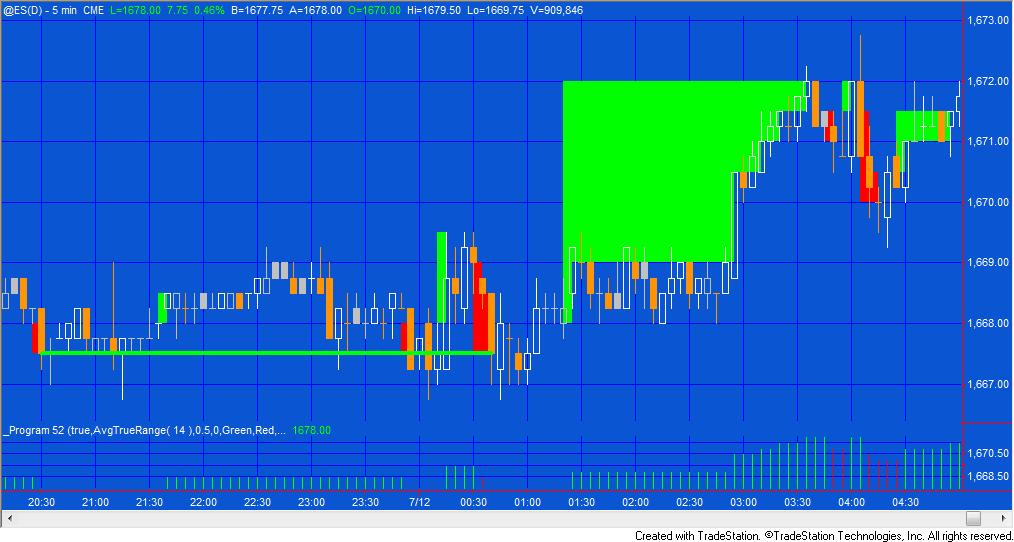
On a Renko chart, support levels can be drawn when several down columns have the same price at the bottom of the column. Resistance levels can be drawn when several up columns have the same price at the top of the columns. Program 52 provides user inputs for the number of columns required to confirm a pattern. The patterns are displayed by drawing lines on the chart. The color of the plots are determined by user inputs. The columns may be ‘stretched’ horizontally to take into account the time element of a regular chart .
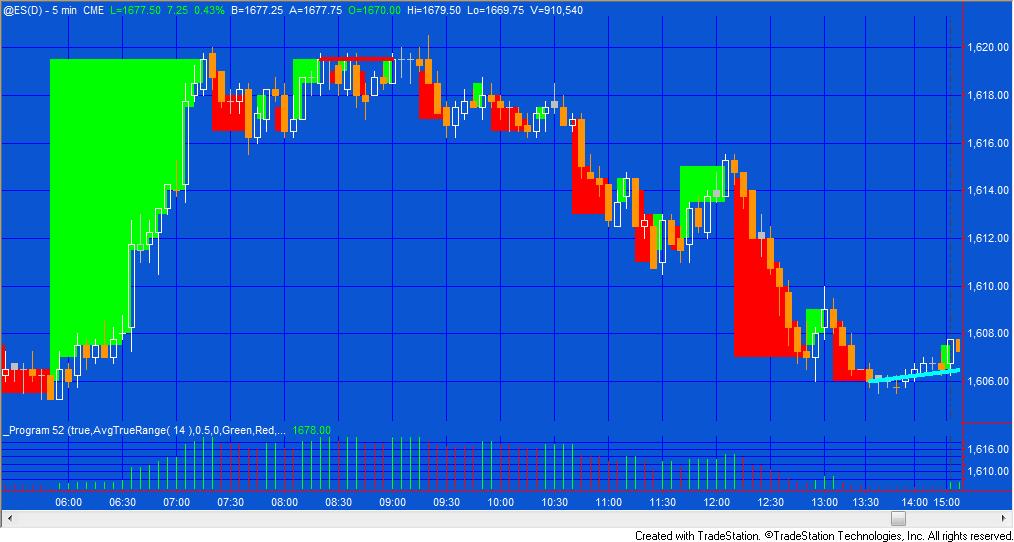
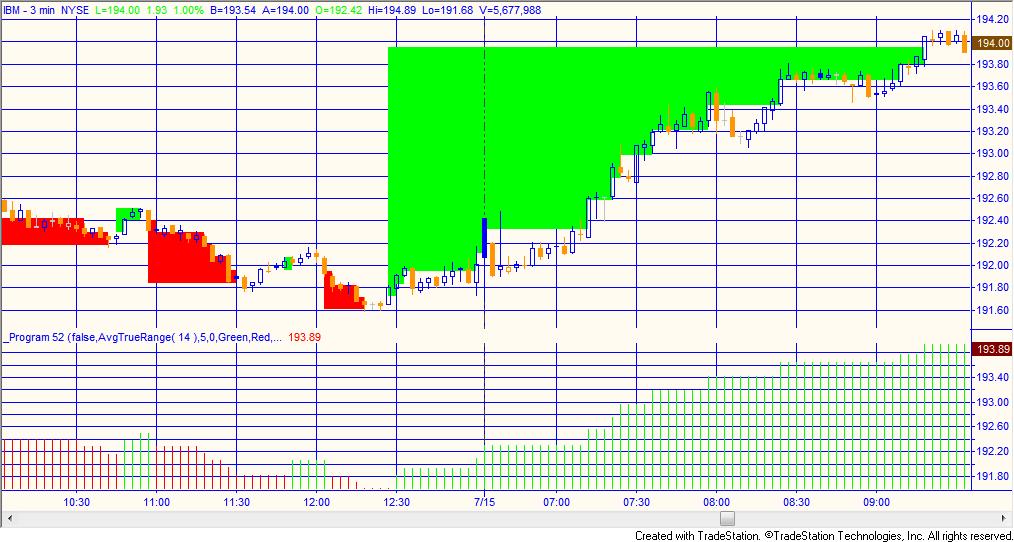
Sloping support and resistance lines
Support lines that slope upward and resistance lines that slope downwards are also highlighted by program 52. On a regular Renko chart these patterns occur when the Renko ‘building blocks’ slope upwards at a 45 degree angle. Because of the time element of a regular chart the equivalent program 52 patterns may not slope at a 45 degree angle, however they may be indicative of possible support or resistance.
Programming notes
Program 52 uses the new DrawObjects class to draw the modified Renko boxes. The DrawObjects class became available in TradeStaion 9.1. update 22 and allows (among other things) the drawing of rectangles together with the ability to shade them or fill them completely.
This program also uses vectors from the Collections class in order to process the support and resistance patterns.
Program 52 was designed for TradeStation 9.1 (update 22 and above). It works on intraday, daily, weekly and monthly charts.
Inputs
FixedBox( TRUE ), // If set to true the modified Renko box size is set to the size specified by the user input: FixedRenkBoxSize
// if set to false the modified Renko box size varies depending on the formula in the user input: VariableRenkoBoxSize
VariableRenkoBoxSize( AvgTrueRange( 14 ) ), // Size of variable sized box
FixedRenkBoxSize( 5 ), // Size of fixed box
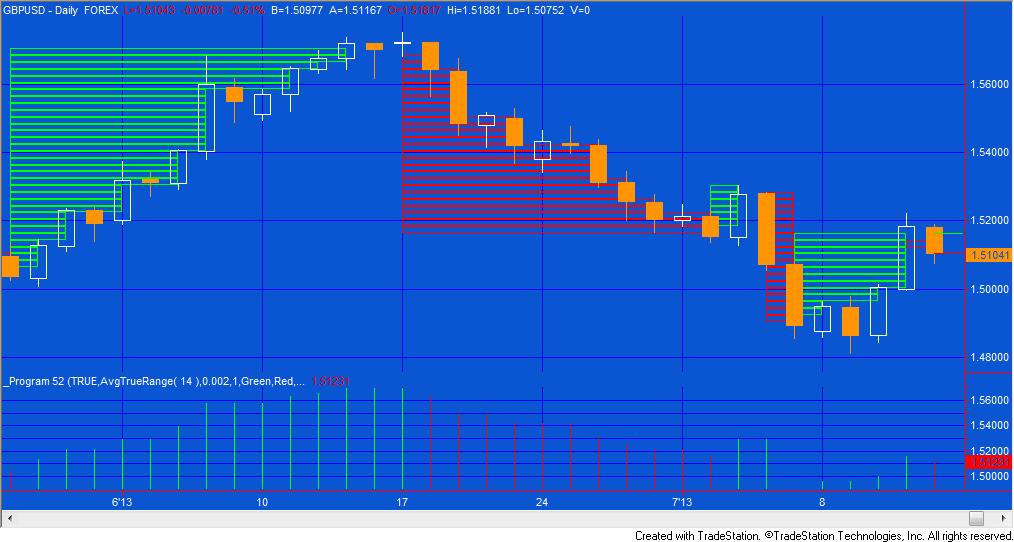
RenkoShading( 0 ), // See fill pattern options above
UpColor( Green ), // Color of up boxes
DnColor( Red ), // Color of down boxes
HiLoMethod( TRUE ), // If TRUE program uses the High – Low methodology, otherwise the close methodology
NumLos( 3 ), // The Number of lows required to highlight multiple equal bottoms
NumHis( 3 ), // The number of highs required to highlight multiple equal tops
NumLosCol( Green ), // Color of line highlighting multiple equal bottoms
NumHisCol( Red ), // Color of line highlighting multiple equal tops
NumRes( 2 ), // The number of highs required to draw a resistance plot
NumSup( 2 );,// The number of lows required to draw a support plot
NumResCol( Magenta ), // Color of lines highlighting resistance plot
NumSupCol( Cyan ); // Color of lines highlighting support plot
Fill pattern options
The following numbers are potential inputs for the user input: RenkoShading.
1: Empty background
2: Horizontal lines
3: Vertical lines
4: Diagonal lines, left to right, top to bottom
5: Diagonal lines, left to right, bottom to top
6: Cross-hatch
7: Diagonal cross-hatch
Video of program 52
Please note that any screen shots on this site are examples and are not meant to imply that any of these programs will generate profitable trades.
Gold Pass bonus information
Program 52 makes extensive use of the new EasyLanguage drawing object classes, particularly the rectangle class which is used to draw the modified Renko boxes.
In the following section I have created a simple show me study that demonstrates how to use the drawing objects class to draw rectangles on a chart. The code is available to be copied and pasted by Gold Pass members. I have also included a short video that aims to explain this show me study.
THESE INDICATORS, SHOW ME STUDIES, STRATEGIES AND OTHER PROGRAMS HAVE BEEN INCLUDED SOLELY FOR EDUCATIONAL PURPOSES.
TO THE BEST OF MARKPLEX CORPORATION’S KNOWLEDGE, ALL OF THE INFORMATION ON THIS PAGE IS CORRECT, AND IT IS PROVIDED IN THE HOPE THAT IT WILL BE USEFUL. HOWEVER, MARKPLEX CORPORATION ASSUMES NO LIABILITY FOR ANY DAMAGES, DIRECT OR OTHERWISE, RESULTING FROM THE USE OF THIS INFORMATION AND/OR PROGRAM(S) DESCRIBED, AND NO WARRANTY IS MADE REGARDING ITS ACCURACY OR COMPLETENESS. USE OF THIS INFORMATION AND/OR PROGRAMS DESCRIBED IS AT YOUR OWN RISK.
ANY EASYLANGUAGE OR POWERLANGUAGE TRADING STRATEGIES, SIGNALS, STUDIES, INDICATORS, SHOWME STUDIES, PAINTBAR STUDIES, PROBABILITYMAP STUDIES, ACTIVITYBAR STUDIES, FUNCTIONS (AND PARTS THEREOF) AND ASSOCIATED TECHNIQUES REFERRED TO, INCLUDED IN OR ATTACHED TO THIS TUTORIAL OR PROGRAM DESCRIPTION ARE EXAMPLES ONLY, AND HAVE BEEN INCLUDED SOLELY FOR EDUCATIONAL PURPOSES. MARKPLEX CORPORATION. DOES NOT RECOMMEND THAT YOU USE ANY SUCH TRADING STRATEGIES, SIGNALS, STUDIES, INDICATORS, SHOWME STUDIES, PAINTBAR STUDIES, PROBABILITYMAP STUDIES, ACTIVITYBAR STUDIES, FUNCTIONS (OR ANY PARTS THEREOF) OR TECHNIQUES. THE USE OF ANY SUCH TRADING STRATEGIES, SIGNALS, STUDIES, INDICATORS, SHOWME STUDIES, PAINTBAR STUDIES, PROBABILITYMAP STUDIES, ACTIVITYBAR STUDIES, FUNCTIONS AND TECHNIQUES DOES NOT GUARANTEE THAT YOU WILL MAKE PROFITS, INCREASE PROFITS, OR MINIMIZE LOSSES.