
Hammer candlestick pattern strategy
This strategy is available for immediate download for $129.95. The download a TradeStation ELD file that includes program 54 (unprotected), the _PandF function, the _3LB function, and a link to a bonus video which explains how to replace the default filters with others.
Program 54 was designed for TradeStation 9.1 (update 22 and above). It works on intraday, daily, weekly and monthly charts.
Update: The program is also now available in a version that works with MultiCharts. This download includes the _PandF function, the _3LB function, and a link to the bonus video.
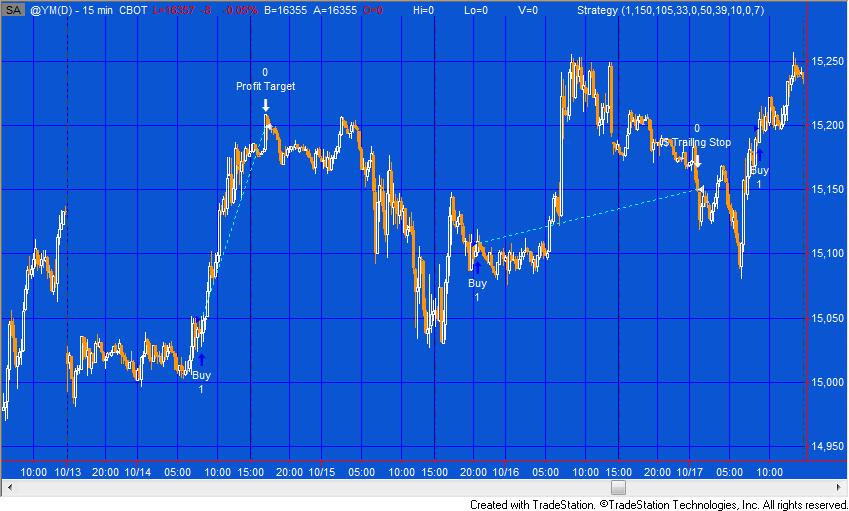
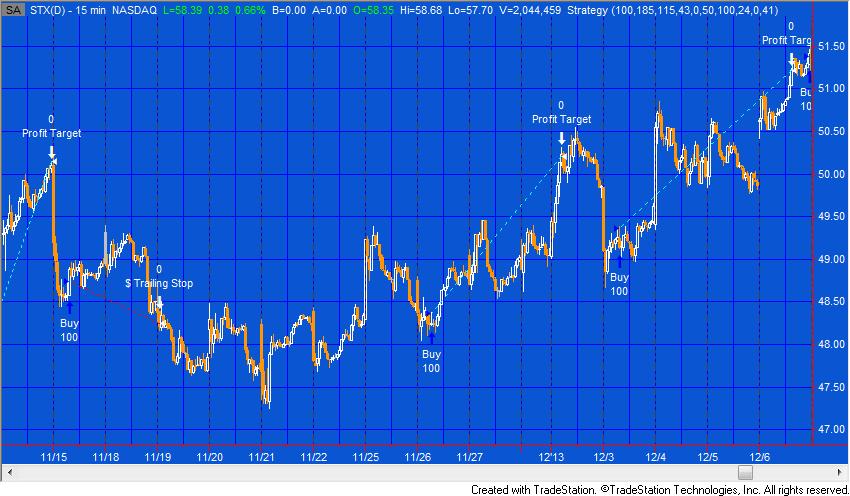
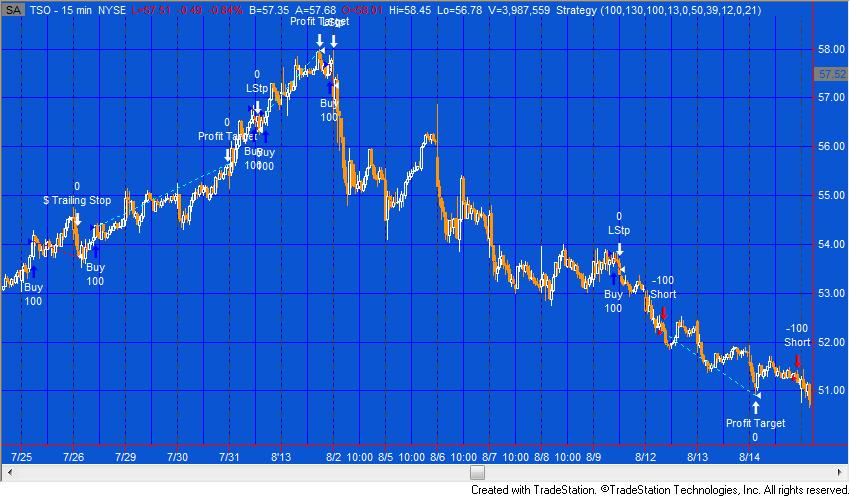
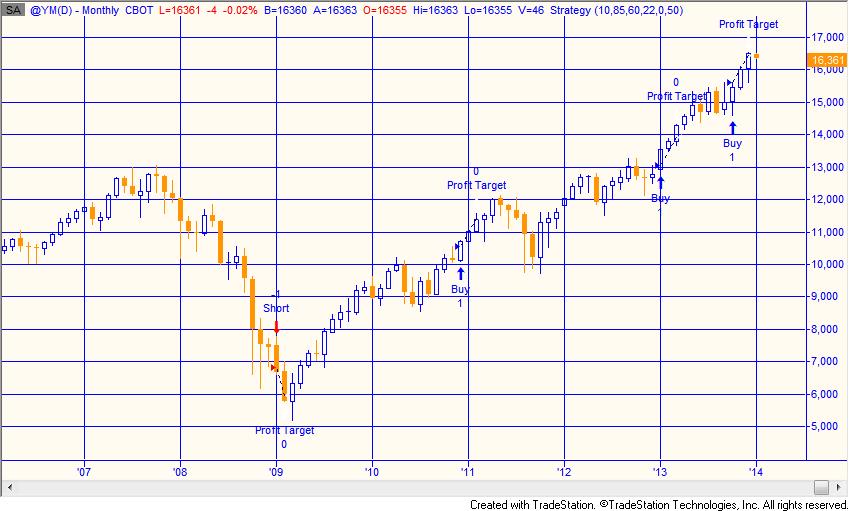
Program 54 is designed to look for a hammer candlestick pattern (see my definition below) in a downtrend (to initiate short trades) and, what I have termed, inverse hammer patterns in an uptrend (to initiate long trades). The program may be applied to futures, equities and forex charts.
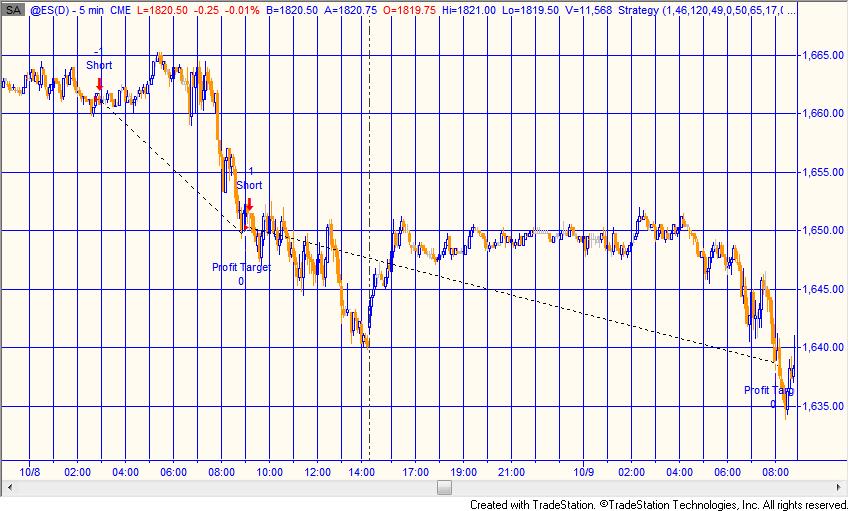
Hammer pattern
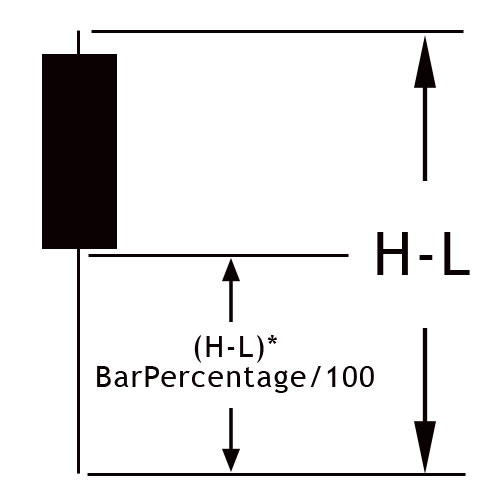
In this program, the hammer pattern is defined as when the body of the candle is relatively small compared to the wick and occurs above the middle horizontal line shown in the image to the right. A user input: BarPercentage determines the exact position of the middle horizontal line.
Similarly, an inverse hammer pattern is defined as when the body of the candle is relatively small compared to the wick and occurs below the middle horizontal line. For inverse hammer patterns the position of the middle line is measured from the high of the bar.
The formulae for determining the patterns are:
Hammer definition
Inverse hammer definition
It would be relatively straightforward to modify this if you required a more stringent definition of a hammer (for example, if the close or open had to be near or at the top of the bar for a hammer pattern).
Trend
By default, the program attempts to find trend in two ways:
- An exponential moving average is calculated. The LinearRegAngle function is used to calculate the angle of the line. If this is greater than a user input angle: MinAngle (zero by default) then a boolean variable, LongFilter2. is set to TRUE. Similarly, if the angle is less than -1 multiplied by the user input angle then the boolean variable, ShortFilter2, is set to true.
- A daily moving average is calculated using a daily price series provider. If the moving average goes up from one day to another LongFilter1 is set to TRUE. If the moving average goes down from one day to another ShortFilter1 is set to TRUE.
- For a long trade to be initiated requires that a hammer pattern occurs and LongFilter1 and LongFilter2 are true. For a short trade to be initiated requires that an inverse hammer pattern occurs and ShortFilter1 and ShortFilter2 are true.
Program 54 was designed for TradeStation 9.1 (update 22 and above). It works on intraday, daily, weekly and monthly charts.
Flexibility and additional capability
The default filters that come with the program are described above, however you may choose to disable these filters, to define your own, or use some other options included in the source code of this program. I describe the process of how to do this is a separate bonus video available with this program.
The program source code includes an example of a stochastic filter.
I also include two filters functions:
- A point and figure function (_PandF)
- A three line break function (_3LB)
These are the same functions that were included in program 51, I explain how you could make use of these in the separate bonus video. To find out more about Markplex point and figure and line break functionality see Program 51.
This strategy is available for immediate download. The download a TradeStation ELD file that includes program 54 (unprotected), the _PandF function, the _3LB function, and a link to a bonus video which explains how to replace the default filters with others.
Program 54 was designed for TradeStation 9.1 (update 22 and above). It works on intraday, daily, weekly and monthly charts.
[colored_box title=”Multicharts version” variation=”orange”]Update: The program is also now available in a version that works with MultiCharts. This download includes the _PandF function, the _3LB function, and a link to the bonus video.
[/colored_box]Inputs
NumCts( 1 ), // Number of contracts to buy or sell
TargetTicks( 95 ), // Number of ticks for target
TrailTicks( 100 ), // Trailing ticks
StopLossTicks( 26 ), // Initial stop loss ticks UNDER the signal bar
BarPercentage( 50 ), // 50 to 100 (determines size of hammer)
EODExitTime( 0 ); // Set to zero if no end of day exit. otherwise set at time before exit bar
Inputs and variables for default filters
EMAPeriod( 65 ), // Input to calculate exponential moving average
Length( 17), // Input to linear regression angle calculation of exponential moving average
MinAngle( 0 ), // Minimum angle of slope
DailyMALen( 6); // Length used to calculate the daily moving average
Trade management
NumCts determines how many contracts to be traded.
TargetTicks determines the number of ticks to the target. The program uses the built in Setprofittarget function.
TrailTicks specifies the number of ticks to set a trailing stop to exit a position based on a specified dollar amount that trails the greatest position profit. The program uses the SetDollarTrailing function.
StopLossTicks determines the initial stop loss ticks from below the low of the signal bar for long positions and from above the high of the signal bar for short positions.
EODExitTime is set to zero if no end of day exit. otherwise set at time of bar before the exit bar.
Order placement
Sell short orders are placed as stop orders one tick below the low of the signal bar.
Buy orders are placed as stop orders one tick above the high of the signal bar.
IntraBarOrderGeneration is set to false in the program.
Video of program 54
This strategy is available for immediate download. The download a TradeStation ELD file that includes program 54 (unprotected), the _PandF function, the _3LB function, and a link to a bonus video which explains how to replace the default filters with others.
Program 54 was designed for TradeStation 9.1 (update 22 and above). It works on intraday, daily, weekly and monthly charts.
[colored_box title=”Multicharts version” variation=”orange”]Update: The program is also now available in a version that works with MultiCharts. This download includes the _PandF function, the _3LB function, and a link to the bonus video.
[/colored_box]Please note that any screen shots on this site are examples and are not meant to imply that any of these programs will generate profitable trades.
THESE INDICATORS, SHOW ME STUDIES, STRATEGIES AND OTHER PROGRAMS HAVE BEEN INCLUDED SOLELY FOR EDUCATIONAL PURPOSES.
TO THE BEST OF MARKPLEX CORPORATION’S KNOWLEDGE, ALL OF THE INFORMATION ON THIS PAGE IS CORRECT, AND IT IS PROVIDED IN THE HOPE THAT IT WILL BE USEFUL. HOWEVER, MARKPLEX CORPORATION ASSUMES NO LIABILITY FOR ANY DAMAGES, DIRECT OR OTHERWISE, RESULTING FROM THE USE OF THIS INFORMATION AND/OR PROGRAM(S) DESCRIBED, AND NO WARRANTY IS MADE REGARDING ITS ACCURACY OR COMPLETENESS. USE OF THIS INFORMATION AND/OR PROGRAMS DESCRIBED IS AT YOUR OWN RISK.
ANY EASYLANGUAGE OR POWERLANGUAGE TRADING STRATEGIES, SIGNALS, STUDIES, INDICATORS, SHOWME STUDIES, PAINTBAR STUDIES, PROBABILITYMAP STUDIES, ACTIVITYBAR STUDIES, FUNCTIONS (AND PARTS THEREOF) AND ASSOCIATED TECHNIQUES REFERRED TO, INCLUDED IN OR ATTACHED TO THIS TUTORIAL OR PROGRAM DESCRIPTION ARE EXAMPLES ONLY, AND HAVE BEEN INCLUDED SOLELY FOR EDUCATIONAL PURPOSES. MARKPLEX CORPORATION. DOES NOT RECOMMEND THAT YOU USE ANY SUCH TRADING STRATEGIES, SIGNALS, STUDIES, INDICATORS, SHOWME STUDIES, PAINTBAR STUDIES, PROBABILITYMAP STUDIES, ACTIVITYBAR STUDIES, FUNCTIONS (OR ANY PARTS THEREOF) OR TECHNIQUES. THE USE OF ANY SUCH TRADING STRATEGIES, SIGNALS, STUDIES, INDICATORS, SHOWME STUDIES, PAINTBAR STUDIES, PROBABILITYMAP STUDIES, ACTIVITYBAR STUDIES, FUNCTIONS AND TECHNIQUES DOES NOT GUARANTEE THAT YOU WILL MAKE PROFITS, INCREASE PROFITS, OR MINIMIZE LOSSES.