
An auto pivot based support and resistance show me study
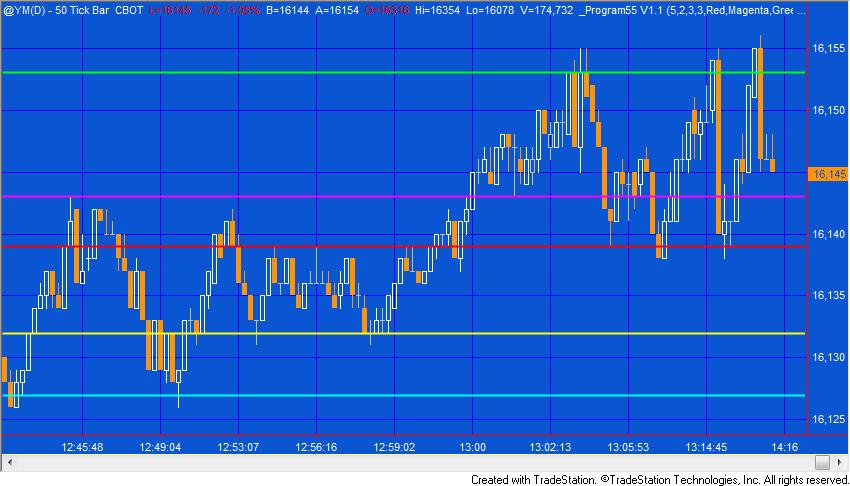
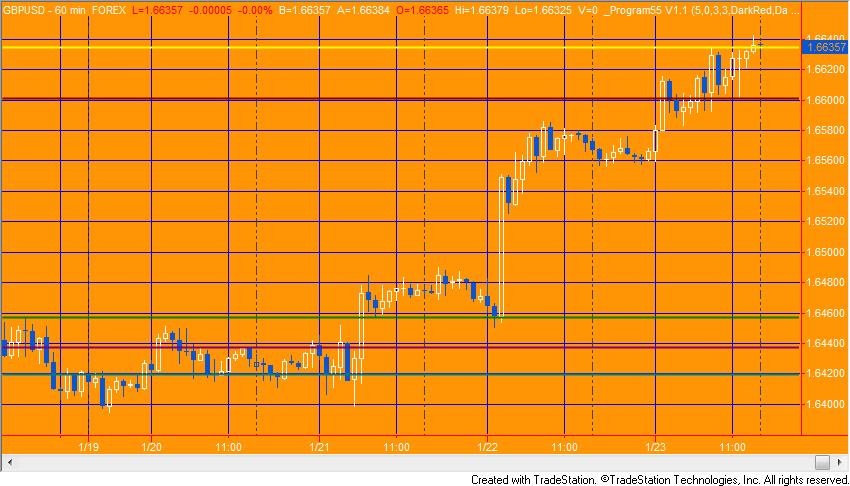
Program 55 creates horizontal support and resistance lines based on the record of levels of previous pivots. The idea behind the program is that if pivots have occurred at a specific level before then that price level may have some significance, especially if they have occurred at the same level (or near to the same level) on several occasions before.
I have just released version 1.2 of program 55. This new version was in response to customer requests and it does everything that was in the original version, plus:
- Price labels at the right of each line (with the ability to change the font and the size of the labels)
- User inputs to define the line style (e.g. dotted, dashed etc)
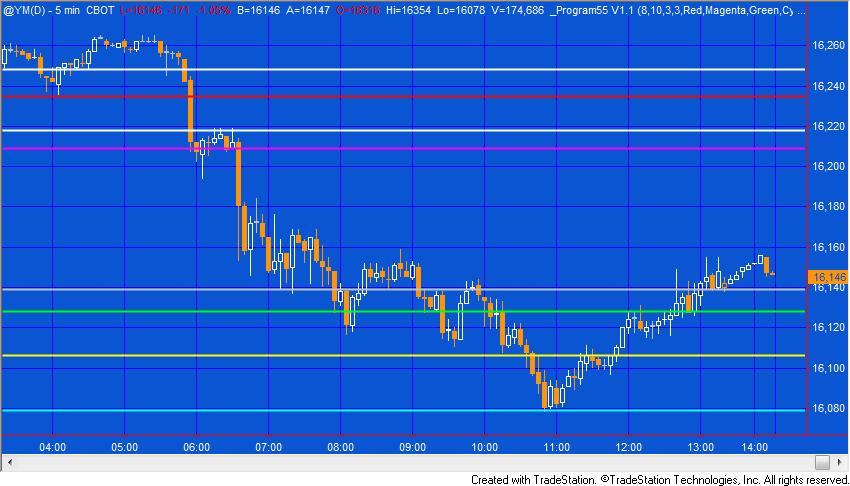
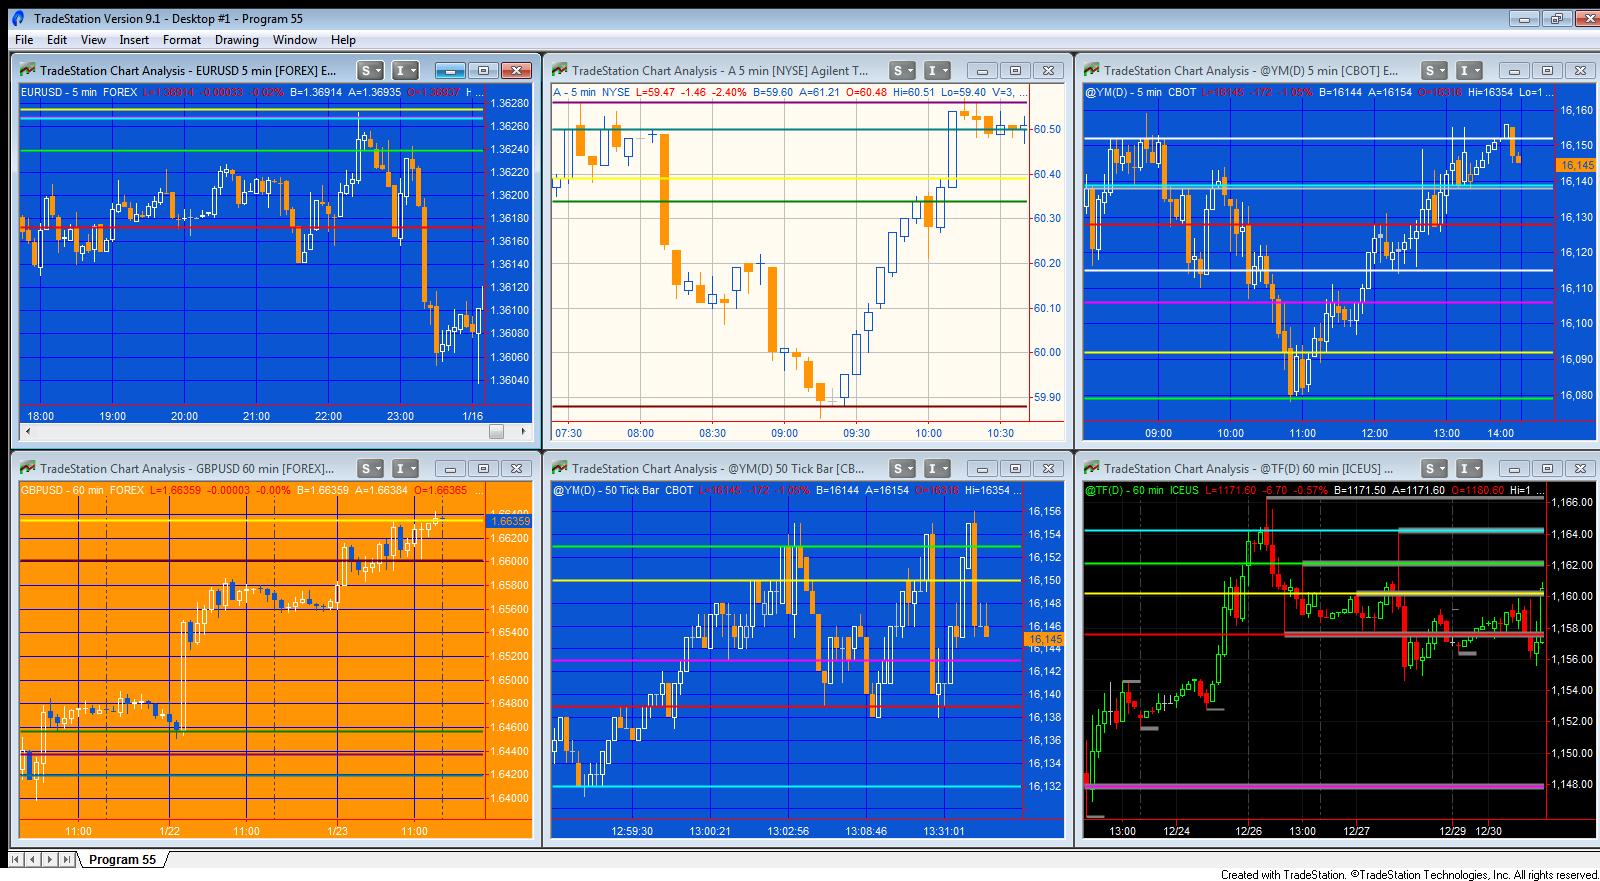
Program 55 was designed for TradeStation 9.1 (update 22) and above. It works on tick, intraday, daily, weekly and monthly charts. This program will not work in MultiCharts because it uses the TradeStation collections and other functionality that is not available in the MultiCharts environment.
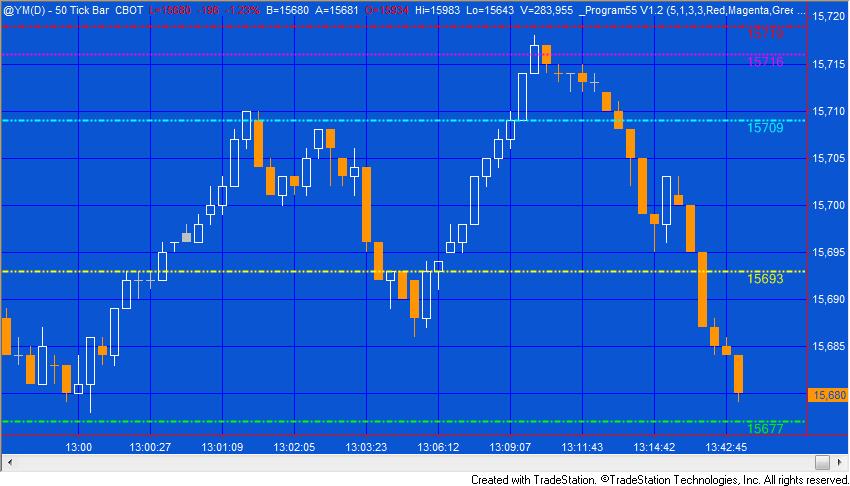
Program 55 has some similarities with the program introduced in tutorial 13 but with some significant differences. Technically it uses TradeStation collections and drawing object technologies. Where tutorial 13 only maintained a record of a specific limited number of pivots, program 55 stores information about every pivot on the chart (after the program starts calculating). Program 55 resamples this vector to populate a smaller vector that just contains levels within the visible area. These levels are ranked based on the number of occurrences at a specific level and the recency of the last pivot at that level. Whereas the original tutorial program changed the weighting of lines based on the number of occurrences, this program varies the colors.
Another feature of this program is the ability to scroll backwards. The program recalculates and draws the lines for the price range visible on the chart. Since occurrences are counted to the end of the chart, this may include future pivots that are effectively projected backwards.
Differences between program 55 and tutorial 13
- Program 55 analyses ALL pivots, not just more recent ones
- In program 55 lines are color coded
- Program 55 recalculates if the screen size is changed
- Program 55 is considerably more efficient
- Program 55 uses newer technologies such as vectors and the new drawing objects
See the video below for a demonstration of the program.
Gold pass members may be interested to know that I posted a free version of the tutorial 13 program in the Q&A section of the Gold Pass membership area. This version is a modification of tutorial 13, so that instead of alerting the thickness of lines based on the number of occurrences occurring at a specific level, it changes the colors.
Program 55 was designed for TradeStation 9.1 (update 22) and above. It works on tick, intraday, daily, weekly and monthly charts. This program will not work in MultiCharts because it uses the TradeStation collections and other functionality that is not available in the MultiCharts environment.
The download includes unprotected source code. This provides numerous example of how to work with EasyLanguage vectors, including:
- Storing vectors within a vector
- Storing different data types within the same vector
- Copying vectors
- Sorting vectors
- Comparing values within a vector in a vector with other elements of the same vector
The program also uses the TradeStation timer and the new drawing objects functionality.
Inputs for program 55 v1.2
TopPivots
The total number of horizontal lines to be drawn, with the highest occurrence values. TopPivots must be a positive integer up to 20. This number determines the number of horizontal lines drawn on a chart. Clearly a large number might make the screen confusing whereas a smaller number might result in the user missing some important levels.
I you enter a number outside the 0 – 20 range, a runtime error will be generated.
CombineVal
Each time an analysis of lines is made, program 55 counts how many times a level occurred at each level plus or minus the CombineVal.
N.B. It is important to make this a sensible number. For example, 1 might be a reasonable input for the mini Dow, however it would be inappropriate for the GBPUSD.
LeftStrength
Left strength of pivots
RightStrength
Right strength of pivots
Line colors
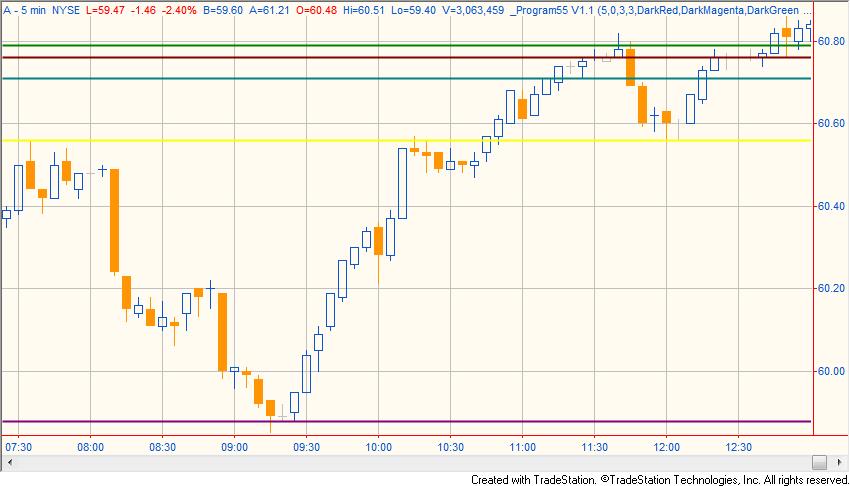
The following inputs determine the color of the horizontal lines draw. Color1 would be for the level that has occurred the most frequently, color2 the level that occurred next most frequently etc. If there are the same number of occurrences at two or more levels, the most recent gets the ‘highest’ color. For example, if there were 40 occurrences at a price of $1.00 and 40 at $1.20 and 40 was the highest number of occurrences, then the pivot that occurred most recently at each level would determine which level was colored Col0r1 and which was colored Color2.
If TopPivots is greater than 10 the colors are ‘recycled’ at a slightly darker shade, so that Color11 would be a darker shade of Color1, Color12 would be a darker shade of Color2 etc
Color1( Red )
Color2( Magenta )
Color3( Green )
Color4( Cyan )
Color5( Yellow )
Color6( White )
Color7( White )
Color8( LightGray )
Color9( LightGray )
Color10( LightGray )
Line styles
Line styles are applied to the lines in the same way as the color styling, i.e. for the level with the highest number of occurrences would be styled using LineStyle1. The level with the next highest number of occurrences would be styled by using LineStyle2 etc.
The available styles are:
- Solid 0
- Dashed 1
- Dotted 2
- Dashed2 3
- Dashed3 4
LineStyle1( 0 )
LineStyle2( 0 )
LineStyle3( 0 )
LineStyle4( 0 )
LineStyle5( 0 )
LineStyle6( 0 )
LineStyle7( 0 )
LineStyle8( 0 )
LineStyle9( 0 )
LineStyle10( 0 )
FontName( “Ariel” )
Font name determines the font of the text that displays the price value of each line to the right of the chart.
FontSize( 10 )
Font size determines that size of the text that displays the price value of each line to the right of the chart.
LineThickness( 1 )
Defines thickness of lines. LineThickness can be an integer between 0 and 6. If a number outside this range is entered a runtime error will be generated.
UpdateFrequency( 5000 )
Determines how often the timer checks for changes in the upper and lower price values. In milliseconds. Since program 55 does a lot of programming it is advisable to keep this number as large as is feasible.
DrawLabels( True)
If set to true labels are added to the right of the horizontal lines.
Inputs for the original version of program 55
TopPivots( 10 ), // The total number of lines to be drawn, with the highest occurrence values. TopPivots can be a positive integer up to 20
CombineVal( 0 ), // The number of ticks abova or below a line to increase the occurance value for the line
LeftStrength( 3 ), // Left strength of pivots
RightStrength( 3 ), // Right strength of pivots
// Define colors for lines
Color1( Red ),
Color2( Magenta ),
Color3( Green ),
Color4( Cyan ),
Color5( Yellow ),
Color6( White ),
Color7( White ),
Color8( LightGray ),
Color9( LightGray ),
Color10( LightGray ),
LineThickness( 1 ), // Defines thickness of lines. LineThickness can be a positive integer up to 6
UpdateFrequency( 5000 ); // Determines how often the timer checks for changes in the upper and lower price values. In milliseconds
Color1 is used for pivot line 1 (the most significant), color2 is used for pivot line 2 (the next most significant) etc. Since TopPivots can be an integer up to 20, for line 11 Color1 is re-used, but at a darker shade. Similarly for line 12, color 2 is re-used, but at a darker shade and so on.
Video of program 55
Video of program 55 v1.2
THESE INDICATORS, SHOW ME STUDIES, STRATEGIES AND OTHER PROGRAMS HAVE BEEN INCLUDED SOLELY FOR EDUCATIONAL PURPOSES.
TO THE BEST OF MARKPLEX CORPORATION’S KNOWLEDGE, ALL OF THE INFORMATION ON THIS PAGE IS CORRECT, AND IT IS PROVIDED IN THE HOPE THAT IT WILL BE USEFUL. HOWEVER, MARKPLEX CORPORATION ASSUMES NO LIABILITY FOR ANY DAMAGES, DIRECT OR OTHERWISE, RESULTING FROM THE USE OF THIS INFORMATION AND/OR PROGRAM(S) DESCRIBED, AND NO WARRANTY IS MADE REGARDING ITS ACCURACY OR COMPLETENESS. USE OF THIS INFORMATION AND/OR PROGRAMS DESCRIBED IS AT YOUR OWN RISK.
ANY EASYLANGUAGE OR POWERLANGUAGE TRADING STRATEGIES, SIGNALS, STUDIES, INDICATORS, SHOWME STUDIES, PAINTBAR STUDIES, PROBABILITYMAP STUDIES, ACTIVITYBAR STUDIES, FUNCTIONS (AND PARTS THEREOF) AND ASSOCIATED TECHNIQUES REFERRED TO, INCLUDED IN OR ATTACHED TO THIS TUTORIAL OR PROGRAM DESCRIPTION ARE EXAMPLES ONLY, AND HAVE BEEN INCLUDED SOLELY FOR EDUCATIONAL PURPOSES. MARKPLEX CORPORATION. DOES NOT RECOMMEND THAT YOU USE ANY SUCH TRADING STRATEGIES, SIGNALS, STUDIES, INDICATORS, SHOWME STUDIES, PAINTBAR STUDIES, PROBABILITYMAP STUDIES, ACTIVITYBAR STUDIES, FUNCTIONS (OR ANY PARTS THEREOF) OR TECHNIQUES. THE USE OF ANY SUCH TRADING STRATEGIES, SIGNALS, STUDIES, INDICATORS, SHOWME STUDIES, PAINTBAR STUDIES, PROBABILITYMAP STUDIES, ACTIVITYBAR STUDIES, FUNCTIONS AND TECHNIQUES DOES NOT GUARANTEE THAT YOU WILL MAKE PROFITS, INCREASE PROFITS, OR MINIMIZE LOSSES.