
Overview
 Tutorial 13 is a program that analyses price action to find pivots (or turning points) that reoccurred close to previously found pivots. The idea was that such levels might represent future areas of support and/or resistance.
Once a turning point or pivot point is found it was compared with turning point levels that had previously been discovered and stored in an array. If the new pivot was within a certain tolerance of the previously discovered pivot then the new pivot was ‘combined’ with the previous pivot level and a variable incremented to indicate how many times the level had been combined with previously discovered levels.
If the new level was not close to an existing level it was stored and potentially drawn on the chart (depending on user input settings).
Pivot confluence strategy
This strategy uses the pivot combining methodology described in tutorial 13 such that if a new pivot is discovered that combines with a previous level, and if that level has been combined over or equal to a user input number of times, then the strategy flags a potential trade.
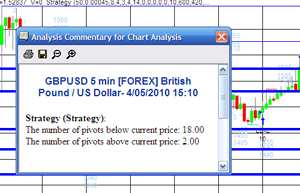 A further condition for entry depends on the number of combined pivots above and below the last pivot found. The program counts the number of combined pivots above the pivot that exceed a user specific weighting (specified by the line sensitivity user input – see below) and those below that exceed a specified weighting.
For a potential long trade the number of pivots below the pivot that exceed a user specified weighting must be greater than those above (that exceed a user specified weighting).
For a short trade the number of pivot lines above the pivot that exceed a user specified weighting must be greater than those below that exceed user specified weighting. The program then evaluates additional user created filters to determine whether to enter a trade. (The above explanation assumes that DirVector is set to zero – see video for more explanation)
The following image shows the filter part of the program:
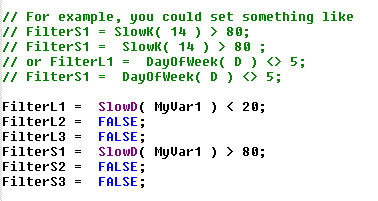
For example, if a simple stochastic filter were, if the combined pivots indicate a potential trade then if SlowD was less than 20, enter long next bar at market. If SlowD is greater than 80 then sell short next bar at market.
Trade management
Once in a trade the program has two targets which are set using user inputs. The targets are expressed as multiple of minimum price move (i.e. Target1 = Tgt1 * MinMove / PriceScale). The second target is incremental to the first target (i.e. Target2 = Tgt2 * MinMove / PriceScale + Target1). A LIMIT order to exit a user inputnumber of contracts (FirstTgtCts) is set at Target1 and another LIMIT order is placed at Target2.
The program also sets a trailing stop whose value is determined by another user input (TrailVal). Trailingstop orders are placed using STOP orders.
User defined options are available to draw the target and trailing stop levels on the chart. If SHOWTRADELINES input is set to FALSE, only today’s targets and trailing stops are shown. If set to TRUE then historical targets and trailing stops are also shown.
To help you develop the strategy further I have added several filters in the program that you can modify to filter out trades based on your trading techniques. By default each filter is set to FALSE, but for example, if you only wanted to enter long trades when FastK( 14 ) was less than 20, you would edit the program and change:
FilterL1 = TRUE ;
to
FilterL1 = FastK( 14 ) < 20;
The video below explains in more detail how the program works and what the various inputs mean. Please be sure to watch it AND READ THE FOLLOWING DISCLAIMER before buying the program.
TO THE BEST OF MARKPLEX CORPORATION’S KNOWLEDGE, ALL OF THE INFORMATION ON THIS PAGE IS CORRECT, AND IT IS PROVIDED IN THE HOPE THAT IT WILL BE USEFUL. HOWEVER, MARKPLEX CORPORATION ASSUMES NO LIABILITY FOR ANY DAMAGES, DIRECT OR OTHERWISE, RESULTING FROM THE USE OF THIS INFORMATION AND/OR PROGRAM(S) DESCRIBED, AND NO WARRANTY IS MADE REGARDING ITS ACCURACY OR COMPLETENESS. USE OF THIS INFORMATION AND/OR PROGRAMS DESCRIBED IS AT YOUR OWN RISK.
ANY EASYLANGUAGE OR POWERLANGUAGE TRADING STRATEGIES, SIGNALS, STUDIES, INDICATORS, SHOWME STUDIES, PAINTBAR STUDIES, PROBABILITYMAP STUDIES, ACTIVITYBAR STUDIES, FUNCTIONS (AND PARTS THEREOF) AND ASSOCIATED TECHNIQUES REFERRED TO, INCLUDED IN OR ATTACHED TO THIS TUTORIAL OR PROGRAM DESCRIPTION ARE EXAMPLES ONLY, AND HAVE BEEN INCLUDED SOLELY FOR EDUCATIONAL PURPOSES. MARKPLEX CORPORATION. DOES NOT RECOMMEND THAT YOU USE ANY SUCH TRADING STRATEGIES, SIGNALS, STUDIES, INDICATORS, SHOWME STUDIES, PAINTBAR STUDIES, PROBABILITYMAP STUDIES, ACTIVITYBAR STUDIES, FUNCTIONS (OR ANY PARTS THEREOF) OR TECHNIQUES. THE USE OF ANY SUCH TRADING STRATEGIES, SIGNALS, STUDIES, INDICATORS, SHOWME STUDIES, PAINTBAR STUDIES, PROBABILITYMAP STUDIES, ACTIVITYBAR STUDIES, FUNCTIONS AND TECHNIQUES DOES NOT GUARANTEE THAT YOU WILL MAKE PROFITS, INCREASE PROFITS, OR MINIMIZE LOSSES.
This unprotected and commented program (i.e. the TradeStation EasyLanguage strategy) is available for immediate download for $119.95 by clicking here to pay using PayPal or credit card:
The program was developed in TradeStation 8.7 (and so is compatible with versions 8.7 and above, including 10).
This strategy uses some of the functionality developed in tutorial 13 . You may find that the information in this link is useful.
The following chart shows the strategy applied to a 5 minute GBPUSD chart. A slow stochastic filter is applied. I added the “COMBINED PIVOT LINE”, “TRAILING STOP” and “FIRST TARGET LEVEL” labels manually using the TradeStation drawing tools.
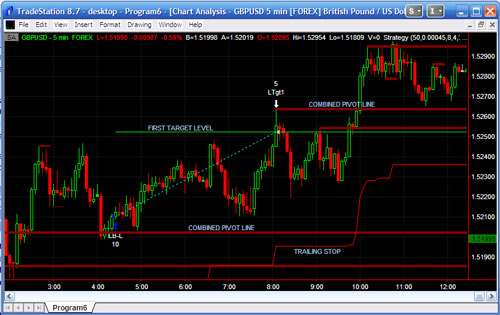
The horizontal green line represents the first target. The red line represents the trailing stop. As you can see, for a long trade, it is adjusted upward as price rises and for a short trade, it is adjusted downwards as price decreases. The target and trailing stop values can be set as inputs.
This unprotected and commented program (i.e. the TradeStation EasyLanguage strategy) is available for immediate download for $119.95 by clicking here to pay using PayPal or credit card:
The program was developed in TradeStation 8.7 (and so is compatible with versions 8.7 and above, including 10).
The following video explains the use of this program in more detail. I would also suggest that you review tutorial 13.
The program has been tested on intraday and daily charts but not with other bar types.
Video demonstration of Program 6 – Pivot Confluence Strategy
Program inputs
NumberPivots( 50 ), // The number of pivots to be stored in the array at any one time (maximum is 500)
CombineVal( 0.15 ), // How close a new pivot has to be to one stored in the array for the 2 to be combined
LineSensitivity( 10 ), // If ShowCombLines is set to TRUE this determines that only lines with this weighting or above are shown. It also factor into whether a trade is made.
LeftStrength( 3 ), // Number of bars to left required when determining if pivot has occurred
RightStrength( 3 ), // Number of bars to right required when determining if pivot has occurred
DirVector( 5 ), // Difference that AbovePiv must exceed BelowPiv for a potential short trade. The reverse for long trade.
MyVar1( 0 ), MyVar2( 0 ), MyVar3( 0 ), MyVar4( 0 ), MyVar5( 0 ), MyVar6( 0 ), // Variables for potential use in user defined filters
Cts( 10 ), // Number of contracts
TrailVal( 100 ), // Trail value – expressed as multiple of minimum price move
Tgt1( 70 ), // First target – expressed as multiple of minimum price move (i.e. Target1 = Tgt1 * MinMove / PriceScale)
Tgt2( 140 ), // Second target – incremental to the first target (i.e. Target2 = Tgt2 * MinMove / PriceScale + Target1)
FirstTgtCts( 5 ), // The number of contracts to be taken off at first target
TodaysPivotsOn( TRUE ), // If set to true extend pivots to the right if date = today
ShowTradeLines( TRUE ), // If set to TRUE historical target and trailing stop lines are drawn – if false just today’s lines
ShowCombLines( TRUE ), // If set to TRUE combined pivot lines are displayed
CombineCol( DarkRed ); // Combined pivot line color
N.B. The results that you receive from program 6 will depend on the inputs you provide and the filters that you create.
This unprotected and commented program (i.e. the TradeStation EasyLanguage strategy) is available for immediate download for $119.95 by clicking here to pay using PayPal or credit card:
The program was developed in TradeStation 8.7 (and so is compatible with versions 8.7 and above, including 10).
The program is ‘unprotected,’ in other words, you will be able to see and edit the program code.
TO THE BEST OF MARKPLEX CORPORATION’S KNOWLEDGE, ALL OF THE INFORMATION ON THIS PAGE IS CORRECT, AND IT IS PROVIDED IN THE HOPE THAT IT WILL BE USEFUL. HOWEVER, MARKPLEX CORPORATION ASSUMES NO LIABILITY FOR ANY DAMAGES, DIRECT OR OTHERWISE, RESULTING FROM THE USE OF THIS INFORMATION AND/OR PROGRAM(S) DESCRIBED, AND NO WARRANTY IS MADE REGARDING ITS ACCURACY OR COMPLETENESS. USE OF THIS INFORMATION AND/OR PROGRAMS DESCRIBED IS AT YOUR OWN RISK.
ANY EASYLANGUAGE OR POWERLANGUAGE TRADING STRATEGIES, SIGNALS, STUDIES, INDICATORS, SHOWME STUDIES, PAINTBAR STUDIES, PROBABILITYMAP STUDIES, ACTIVITYBAR STUDIES, FUNCTIONS (AND PARTS THEREOF) AND ASSOCIATED TECHNIQUES REFERRED TO, INCLUDED IN OR ATTACHED TO THIS TUTORIAL OR PROGRAM DESCRIPTION ARE EXAMPLES ONLY, AND HAVE BEEN INCLUDED SOLELY FOR EDUCATIONAL PURPOSES. MARKPLEX CORPORATION. DOES NOT RECOMMEND THAT YOU USE ANY SUCH TRADING STRATEGIES, SIGNALS, STUDIES, INDICATORS, SHOWME STUDIES, PAINTBAR STUDIES, PROBABILITYMAP STUDIES, ACTIVITYBAR STUDIES, FUNCTIONS (OR ANY PARTS THEREOF) OR TECHNIQUES. THE USE OF ANY SUCH TRADING STRATEGIES, SIGNALS, STUDIES, INDICATORS, SHOWME STUDIES, PAINTBAR STUDIES, PROBABILITYMAP STUDIES, ACTIVITYBAR STUDIES, FUNCTIONS AND TECHNIQUES DOES NOT GUARANTEE THAT YOU WILL MAKE PROFITS, INCREASE PROFITS, OR MINIMIZE LOSSES.