
Stochastic RSI
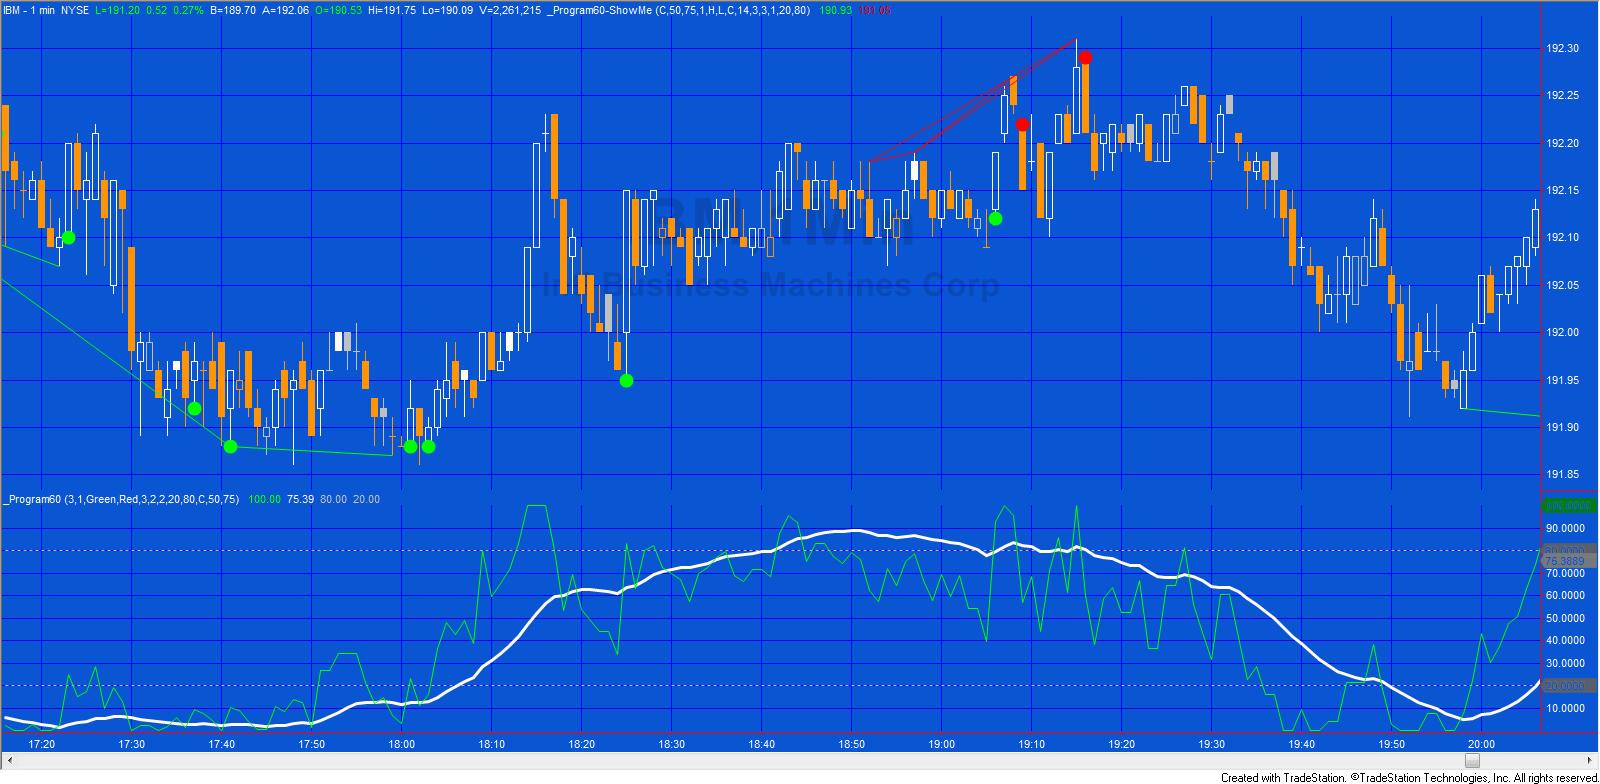
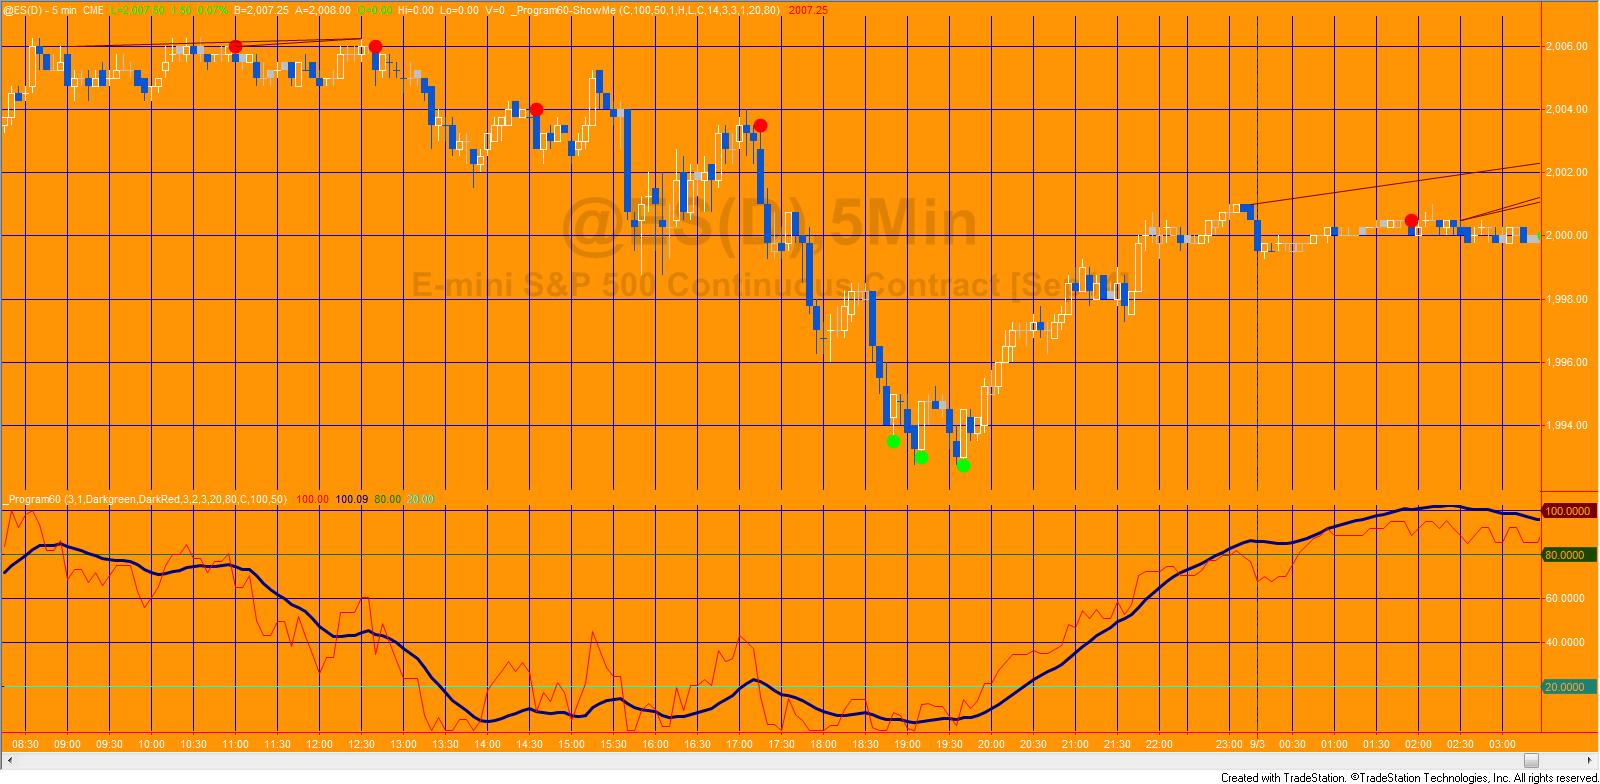
Program 60 consists of a stochastic of the RSI indicator and show me study. The stochastic of the RSI can be helpful in identifying potential tops and bottoms on a chart.
The program 60 packages includes:
- An indicator (_Program60) that plots the stochastic of RSI and a smoothed version of the stochastic of RSI. It also looks for divergence between price and either the stochastic of RSI or the smoothed version of the stochastic of RSI, depending on a user input. When divergence is found, lines are drawn between the price points on the chart.
- A show me study (_Program60-ShowMe) that plots at the turning points of the stochastic of RSI or the smoothed version of the stochastic of RSI, depending on a user input. It is filtered according to a stochastic being overbought or oversold.
- Gold pass members can also access a free video below that shows how to use a GlobalValue to communicate a user input from the indicator to the show me study.
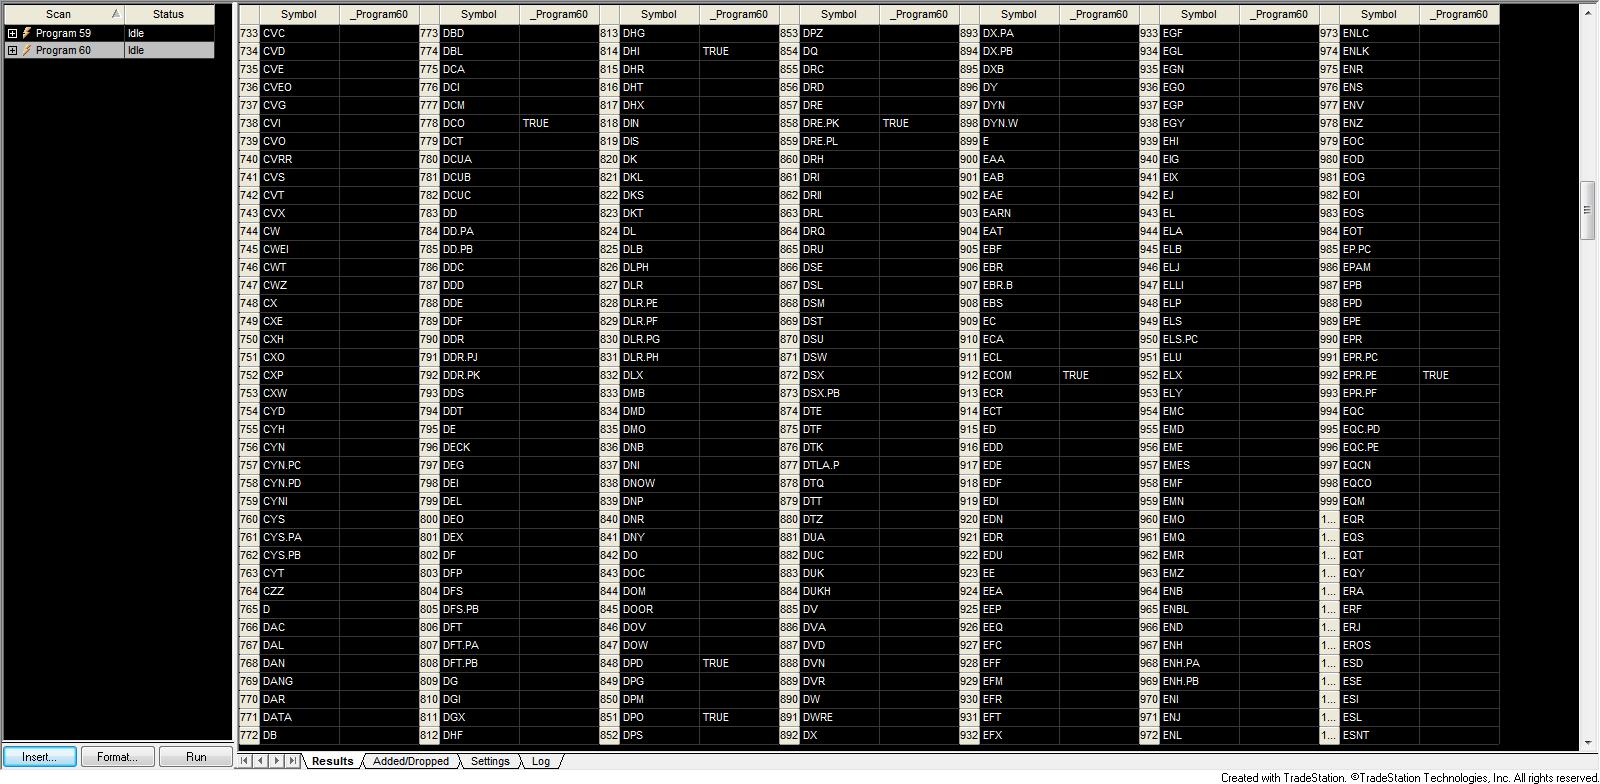
The programs work with charts, RadarScreen and Scanner and with both TradeStation and MultiCharts. An ELD file containing both programs may be downloaded for $49.95.
Gold Pass members get an additional 20% discount off all program and tutorial prices. If you are a Gold Pass member make sure you enter the special coupon code to get 20% discount off these prices. You can find the coupon code on the Gold Pass page.
In order to be MultiCharts compatible, the indicator uses legacy drawing object to draw lines on the charts indicating divergence. On tick charts these lines may be misplaced by several bars if those bars share the same minute based time signature.

Program 60 video
The following video provides some guidance as to how to use _Program60 and _Program60-ShowMe.
_Program60 user inputs
MaxArraySize( 3 ), // Maximum = 5. Determines how many previous pivots are compared each time a new price pivot and corresponding Stochastic pivot are discovered
WhichStochRSI( 1 ), // Determines whether program uses StochRSI or smoothed StochRSI for calculating divergences (0 = StochRSI, 1 = smoothed StochRSI )
LowerColor( Darkgreen ), // Color of lines drawn on price chart indicating possible bullish divergence
UpperColor( DarkRed ), // Color of lines drawn on price chart indicating possible bearish divergence
LeftStrength( 3 ), // Left strength of pivots
RightStrength( 2 ), // Right strength of pivots
BarTol( 3 ), // The number of bars within which the price and RSI Stochastic pivot must occur for the pivots to be considered to have occurred on the same bar
OverSold( 20 ), // Horizontal line plotted at this level
OverBought( 80 ), // Horizontal line plotted at this level
Price( C ), // Price used in RSI calculation
SRLength( 14 ), // Length used in the RSI calculation
SmoothLength( 5 ); // Smoothing length used to smooth the stochastic of the RSI
_Program60-ShowMe user inputs
Price( C ), // Price used in RSI calculation
SRLength( 14 ), // Length used in RSI calculation
SmoothLength( 5 ), // Length used to smmoth the stochastic of RSI
WhichStochRSI( 1 ), // Determines whether program uses StochRSI or smoothed StochRSI for calculating divergences (0 = StochRSI, 1 = smoothed StochRSI )
PriceH( H ), // Input to stochastic calculation and price used to find high pivots
PriceL( L ), // Input to stochastic calculation and price used to find low pivots
PriceC( C ), // Input to stochastic calculation
StochLength( 14 ), // Input to stochastic calculation
SmoothingLength1( 3 ), // Used to slow FastK to FastD = SlowK in stochastic calculation
SmoothingLength2( 3 ), // Used to slow FastD to SlowD in stochastic calculation
SmoothingType( 1 ), // SmoothingType = 1 for Original, SmoothingType = 2 for Legacy in stochastic calculation
The programs work with charts, RadarScreen and Scanner and with both TradeStation and MultiCharts. An ELD file containing both programs may be downloaded for $49.95.
Gold Pass members get an additional 20% discount off all program and tutorial prices. If you are a Gold Pass member make sure you enter the special coupon code to get 20% discount off these prices. You can find the coupon code on the Gold Pass page.
Program 60 bonus video for Gold Pass members
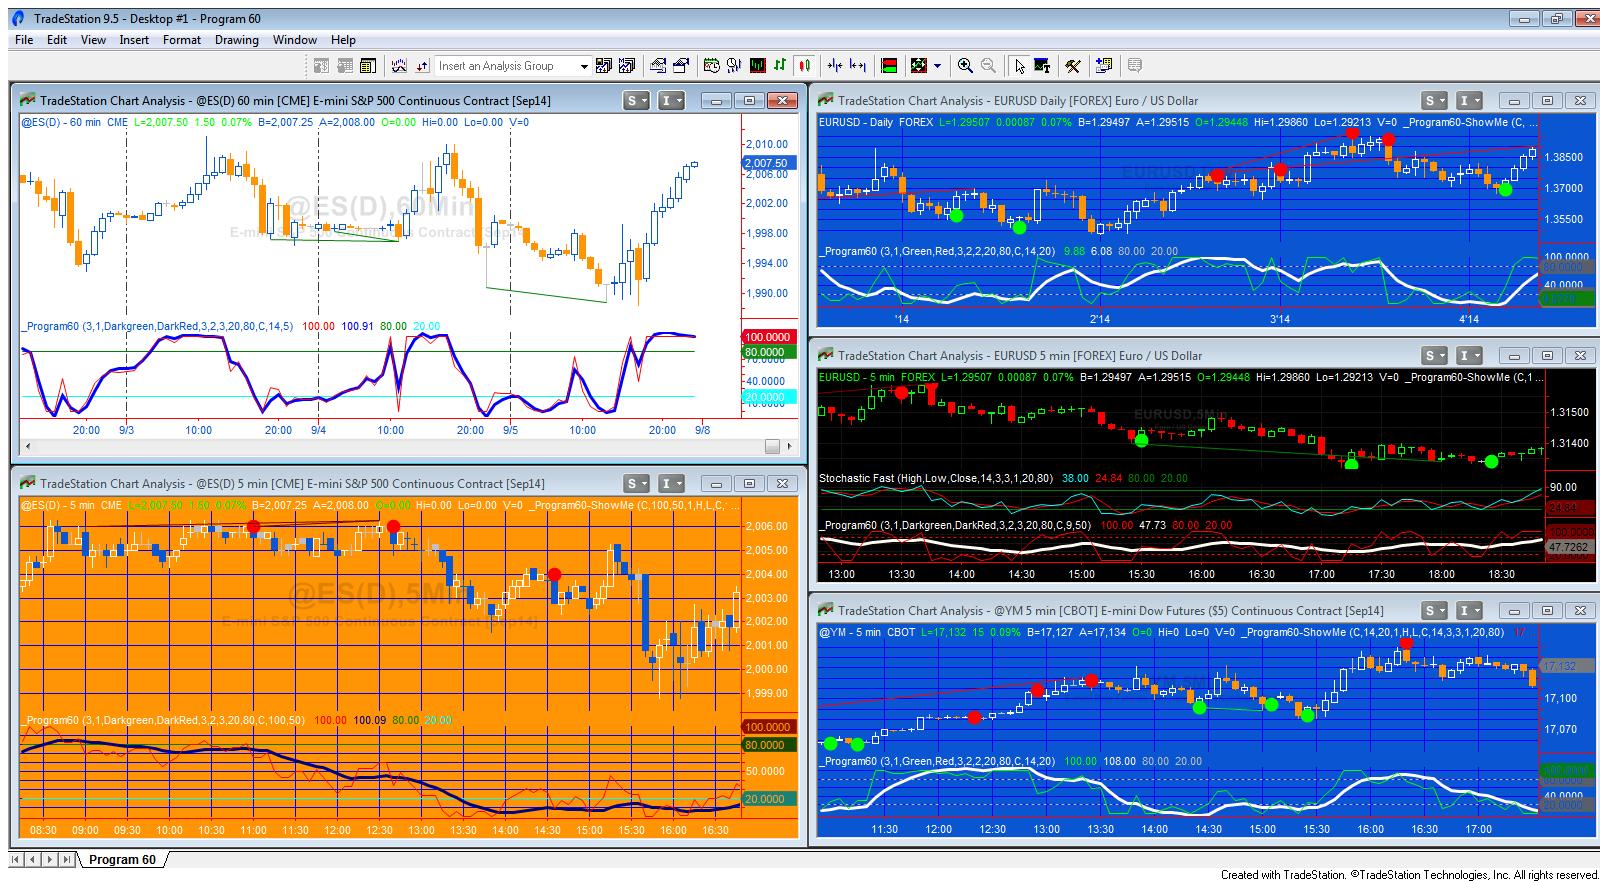
Additional screen shots of program 60
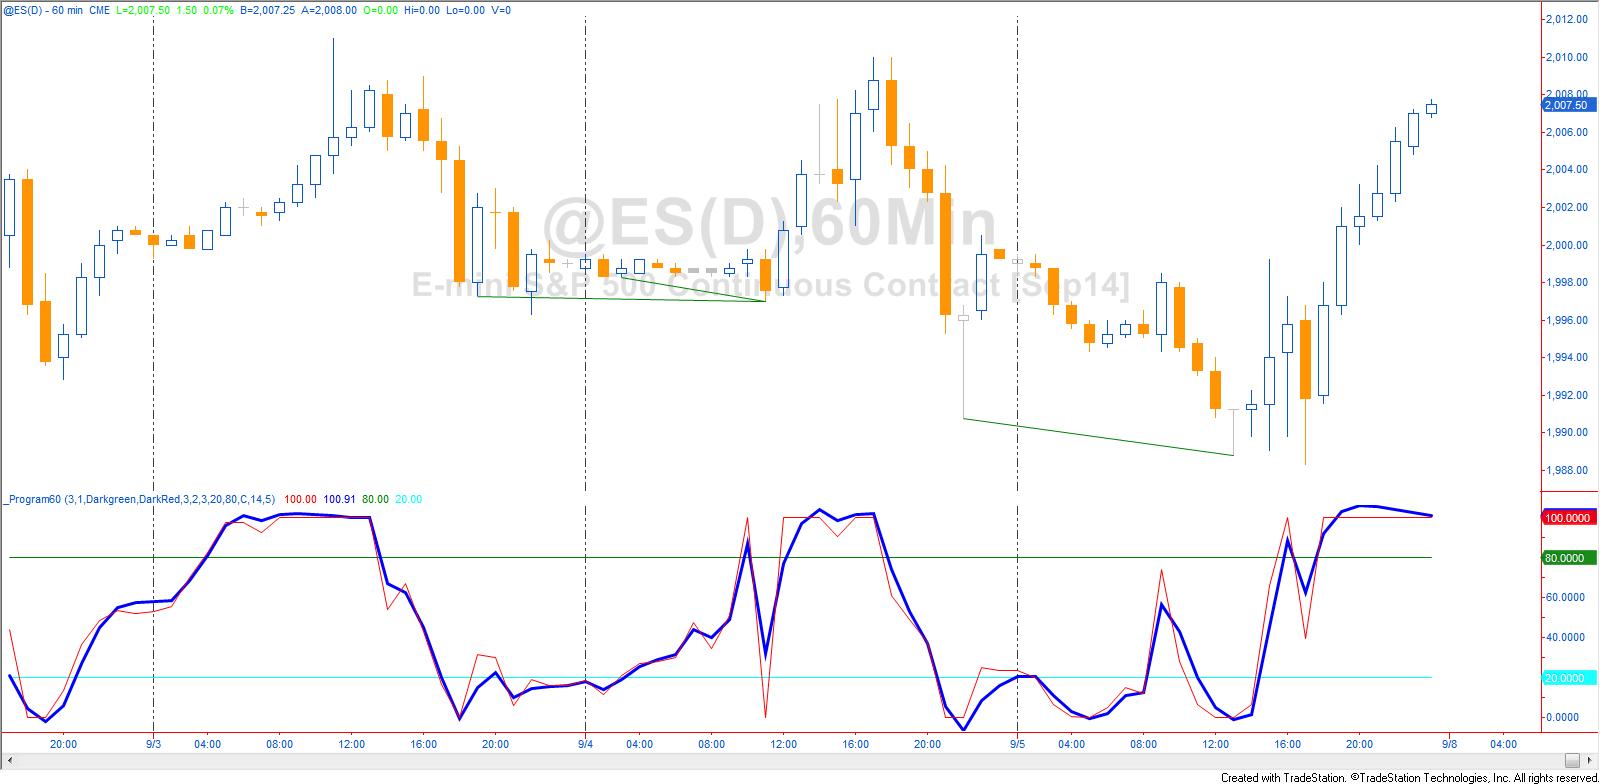
Please note that any screen shots on this site are examples and are not meant to imply that any of these programs will generate profitable trades. THESE INDICATORS, SHOW ME STUDIES, STRATEGIES AND OTHER PROGRAMS HAVE BEEN INCLUDED SOLELY FOR EDUCATIONAL PURPOSES.
TO THE BEST OF MARKPLEX CORPORATION’S KNOWLEDGE, ALL OF THE INFORMATION ON THIS PAGE IS CORRECT, AND IT IS PROVIDED IN THE HOPE THAT IT WILL BE USEFUL. HOWEVER, MARKPLEX CORPORATION ASSUMES NO LIABILITY FOR ANY DAMAGES, DIRECT OR OTHERWISE, RESULTING FROM THE USE OF THIS INFORMATION AND/OR PROGRAM(S) DESCRIBED, AND NO WARRANTY IS MADE REGARDING ITS ACCURACY OR COMPLETENESS. USE OF THIS INFORMATION AND/OR PROGRAMS DESCRIBED IS AT YOUR OWN RISK.
ANY EASYLANGUAGE OR POWERLANGUAGE TRADING STRATEGIES, SIGNALS, STUDIES, INDICATORS, SHOWME STUDIES, PAINTBAR STUDIES, PROBABILITYMAP STUDIES, ACTIVITYBAR STUDIES, FUNCTIONS (AND PARTS THEREOF) AND ASSOCIATED TECHNIQUES REFERRED TO, INCLUDED IN OR ATTACHED TO THIS TUTORIAL OR PROGRAM DESCRIPTION ARE EXAMPLES ONLY, AND HAVE BEEN INCLUDED SOLELY FOR EDUCATIONAL PURPOSES. MARKPLEX CORPORATION. DOES NOT RECOMMEND THAT YOU USE ANY SUCH TRADING STRATEGIES, SIGNALS, STUDIES, INDICATORS, SHOWME STUDIES, PAINTBAR STUDIES, PROBABILITYMAP STUDIES, ACTIVITYBAR STUDIES, FUNCTIONS (OR ANY PARTS THEREOF) OR TECHNIQUES. THE USE OF ANY SUCH TRADING STRATEGIES, SIGNALS, STUDIES, INDICATORS, SHOWME STUDIES, PAINTBAR STUDIES, PROBABILITYMAP STUDIES, ACTIVITYBAR STUDIES, FUNCTIONS AND TECHNIQUES DOES NOT GUARANTEE THAT YOU WILL MAKE PROFITS, INCREASE PROFITS, OR MINIMIZE LOSSES.