
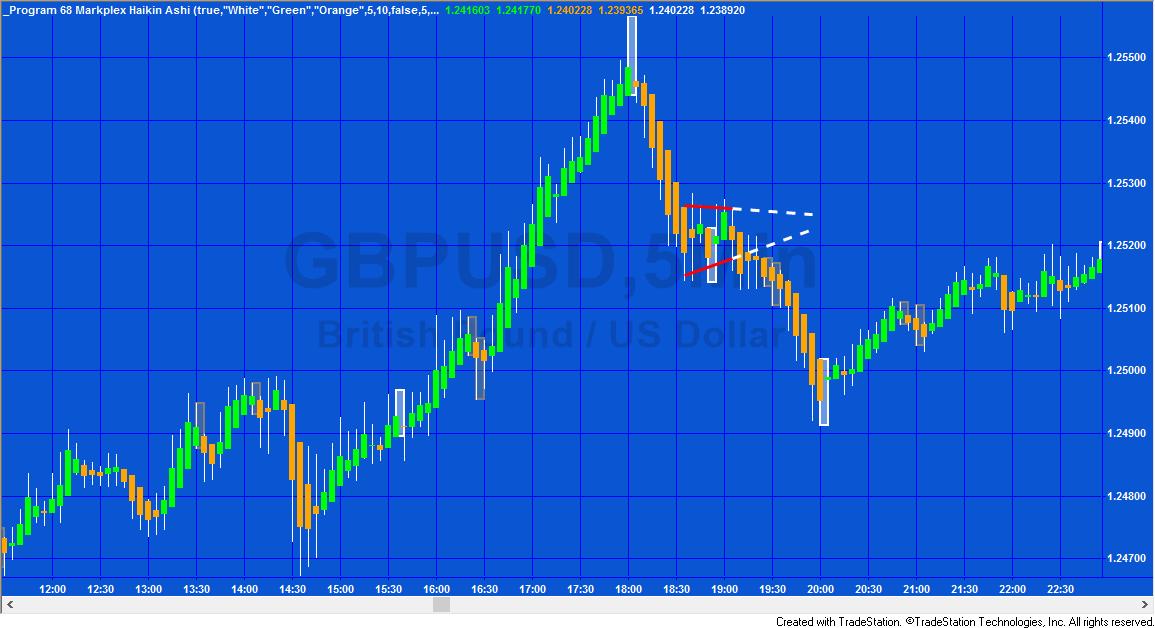
Markplex Heikin-Ashi candlesticks
Heikin-Ashi candlesticks attempt to remove noise from price data to make it easier to see price direction. This program calculates and displays Heikin-Ashi candlesticks, various candlestick patterns and indicates price consolidation.
Why Heikin-Ashi bars?

Heikin-Ashi bars can be used to help traders identify when the market is trending. In the Markplex implementation, the user may select the color of the up and down bars. Up bars with no lower shadow indicates a strong uptrend. Similarly, down bars with no upper shadow indicate a strong downtrend. A bar with a long upper and lower indicates indecision in the market and a possible trend change.
The bars are calculated by using the open, close, high, and low of the current bar and the Heikin-Ashi open and the Heikin-Ashi close of the previous candlestick.
Heikin-Ashi Close = ( O + H + L + C ) / 4;
Heikin-Ashi Open = ( Heikin-Ashi Open one bar ago + Heikin-Ashi Close one bar ago ) / 2;
Heikin-Ashi High = Maxlist( H, Heikin-Ashi Open, Heikin-Ashi Close );
Heikin-Ashi Low = Minlist( L, Heikin-Ashi Open, Heikin-Ashi Close );
Program 68 consists of a TradeStation EasyLanguage indicator (_Program 68 Markplex Heikin Ashi) and a function (_Program68LinearRegression) designed for use with charts that:
- Calculate and display the Heikin-Ashi candlesticks (using an indicator and plot statements)
- Look for and displays areas of consolidation (that may precede price expansion)
- Search for and display the following candlestick patterns:
- Doji
- 3 White Soldiers/ 3 Black Crows
- Bullish and bearish Haramis
- Hammer or Hanging man
Price consolidation is measured by calculating True Price Channel / Average True Range. In the program the Heikin-Ashi values are used. If the value calculated is less that the user input value: MaxConsolIndex the _Program68LinearRegression function is called.
_Program68LinearRegression function
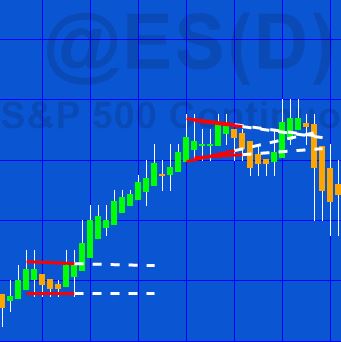
The function included with program 68 is used to display areas of consolidation. If found by the calling program, the function calculates the linear regression for input values. In this program we call the function for the Heikin-Ashi high of the bar and it draws a linear regression line. We also call it using the Heikin-Ashi low of the bar and it draws a linear regression line. These lines are continued for an additional ten bars.
The function ( _Program68LinearRegression) is called as follows:
Value1 = _Program68LinearRegression( StartBar, NumBars, Price, LineColor, ContinuationColor, TLWeight );
where:
int StartBar( numericsimple ), // 0 = Current bar, 1 = one bar ago, 2 = two bars ago etc
int NumBars( numericsimple ), // How many bars to calculate linear regression over
double Price( numericseries ), // Value to calculate linear regression of
string LineColor( stringsimple ),
string ContinuationColor( stringsimple ),
int TLWeight( numericsimple ); // The weight of the trendlines
for example, in the program the function is called like the following for the high Haikin-Ashi bars:
Value1 = _Program68LinearRegression( 0, Consol_Length, HA_High, CongestionColor, CongestionColorCont, TLWeight );
See the video demonstration below for a demonstration of the program.

The program uses EasyLanguage drawing objects to draw rectangles to highlight candlestick patterns and draws pairs of lines to show areas of consolidation.
It was written for charts for TradeStation 9.5 and higher.
Use of BNPoints
A BNPoint refers to the absolute bar index (zero-based) of the collection of bars in a chart. This is not the same as the BarNumber function or CurrentBar reserved word which count the number of bars available for analysis MaxBarsBack. So to create a BNPoint for the current bar (BarNumber) would be:
NewBar = BarNumber + MaxBarsBack – 1;
Another issue that can cause what appear to be spurious results are the ‘Show empty daily trading periods for traditional chart types’ and ‘Show empty intraday session periods for traditional chart types’ settings.
A BNPoint refers to the absolute bar index (zero-based) of the collection of bars in a chart. This is not the same as the BarNumber function or CurrentBar reserved word which count the number of bars available for analysis after MaxBarsBack. So to create a BNPoint for the current bar (BarNumber) would be:
NewBar = BarNumber + MaxBarsBack – 1;
Another issue that can cause what appear to be spurious results are the ‘Show empty daily trading periods for traditional chart types’ and ‘Show empty intraday session periods for traditional chart types’ settings.
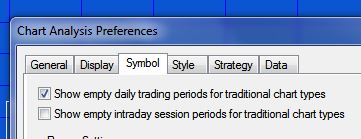
If these are selected, the chart includes blank bars which ‘confuse’ the bar number for BNPoints. For example, in the following daily chart of IBM, the ‘Show empty daily trading periods for traditional chart types’ is selected.
It is possible with this program to choose to NOT display the Heikin-Ashi bars by setting the Plot_Heikin_Ashi input to FALSE. This does not affect the display of the candlestick and breakout patterns (for example, on a regular bar chart).
After purchase you will be redirected to a download page, so don’t close the browser.
Programming lessons

Program 68 and the associated function are commented within the program and demonstrate various useful programming techniques and constructs, including:
- Using the rectangle and line drawing objects
- Creating and calling a function
- Recreating candlestick pattern functions for Heikin-Ashi bars
- Creating a method with six inputs
- Calculating where consolidation may be occurring
- Using the new TradeStation palette of colors
- Using BarHi and BarLo plot statements
- Specifying bar and price levels using BNPoint
The video also explains how to set up the chart to hide the normal bars and replace them with Heikin-Ashi bars.
Video demonstration of program 68 – part 1
Video demonstration of program 68 – part 2
Program 68 bonus video for Gold Pass members
In this third video I explain how the function included with program 68 works.
Program 68 Inputs
// Heikin Ashi bars
bool Plot_Heikin_Ashi( True ), // If set to true, Heikin Ashi bars are plotted
string Wick_Color( “White” ), // The wick color of Heikin Ashi bars
string Up_Color( “Green” ), // Up color for Heikin Ashi bars
string Dn_Color( “Red” ), // Down color for Heikin Ashi bars
// Inputs for candlestick patterns
int Length( 5 ),
double Percent( 10 ),
// Doji and candlestick inputs
Bool UseDoji( FALSE ),
int Doji_Percent( 5 ), // Defines the maximum boy size of a percentage of the wick
string Doji_Color( “AliceBlue” ), // Sets the color of a rectangle drawn around the doji
Bool UseWhiteSoldiersBlackCrows( TRUE ), // Use this Candlestick pattern (TRUE = yes, FALSE = no)
String Soldier_Color( “Orange” ),
Bool UseHarami( TRUE ), // Use this Candlestick pattern (TRUE = yes, FALSE = no)
String Harami_Color( “Peach” ),
Bool UseHammer( TRUE ), // Use this Candlestick pattern (TRUE = yes, FALSE = no)
String Hammer_Color( “White”),
String Hanging_Color( “Green” ),
int Transparency( 255 ), // An integer between 0 and 255
// Consolidation pattern functionality
int Consol_Length( 7 ), // The length over which the consolidation pattern is calculated
double MaxConsolIndex( 1.5 ), // The maximum value of the consolidation index that indicates a consolidation pattern
string CongestionColor( “Red” ), // Color of consolidation boundary lines
string CongestionColorCont( “White”), // Color of consolidation extension lines
int TLWeight( 2 ); // Weight of the trend lines in the consolidation pattern
In _Program 68 Markplex Heikin Ashi v1.1, The following two inputs have been added to stop a potential error caused by too many drawing objects being on the chart:
int MaxNumRectangles( 4500 ), // Maximum number of rectangles that can be drawn on the chart (after reaching this number the older one is deleted)
int MaxNumTLs( 4500 ); // Maximum number of trend lines that can be drawn on the chart (after reaching this number the older ones is deleted)
In latest version: _Program 68 Markplex Heikin Ashi v1.2, a bug was corrected in a function called by the program that had caused a negative bar number error in TradeStation version 10.0.


Program download
After purchase you will be redirected to a download page, so don’t close the browser.
Note that both program names begin with an underscore, so they should be towards the start of the list.
If you are a Gold Pass member make sure you enter the special coupon code to get 20% discount off this price.
Available colors
| AliceBlue | DarkSlateGray | LightSalmon | PaleVioletRed |
| AntiqueWhite | DarkTurquoise | LightSeaGreen | PapayaWhip |
| Aqua | DarkViolet | LightSkyBlue | PeachPuff |
| Aquamarine | DeepPink | LightSlateGray | Peru |
| Azure | DeepSkyBlue | LightSteelBlue | Pink |
| Beige | DimGray | LightYellow | Plum |
| Bisque | DodgerBlue | Lime | PowderBlue |
| Black | Firebrick | LimeGreen | Purple |
| BlanchedAlmond | FloralWhite | Linen | Red |
| Blue | ForestGreen | Magenta | RosyBrown |
| BlueViolet | Fuschia | Maroon | RoyalBlue |
| Brown | Gainsboro | MediumAquamarine | SaddleBrown |
| Burlywood | GhostWhite | MediumBlue | Salmon |
| CadetBlue | Gold | MediumOrchid | SandyBrown |
| Chartreuse | Goldenrod | MediumPurple | SeaGreen |
| Chocolate | Gray | MediumSeaGreen | Seashell |
| Coral | Green | MediumSlateBlue | Sienna |
| CornflowerBlue | GreenYellow | MediumSpringGreen | Silver |
| Cornsilk | Honeydew | MediumTurquoise | SkyBlue |
| Cyan | HotPink | MediumVioletRed | SlateBlue |
| DarkBlue | IndianRed | MidnightBlue | SlateGray |
| DarkBrown | Indigo | MintCream | Snow |
| DarkCyan | Ivory | MistyRose | SpringGreen |
| DarkGoldenrod | Khaki | Moccasin | SteelBlue |
| DarkGray | Lavender | NavajoWhite | Tan |
| DarkGreen | LavenderBlush | Navy | Teal |
| DarkKhaki | LawnGreen | OldLace | Thistle |
| Dark Magenta | LemonChiffon | Olive | Tomato |
| DarkOliveGreen | LightBlue | OliveDrab | Turquoise |
| DarkOrange | LightCoral | Orange | Violet |
| DarkOrchid | LightCyan | OrangeRed | Wheat |
| DarkRed | LightGoldenrodYellow | Orchid | White |
| DarkSalmon | LightGray | PaleGoldenrod | WhiteSmoke |
| DarkSeaGreen | LightGreen | PaleGreen | Yellow |
| DarkSlateBlue | LightPink | PaleTurquoise | YellowGreen |
THESE INDICATORS, SHOW ME STUDIES, STRATEGIES AND OTHER PROGRAMS HAVE BEEN INCLUDED SOLELY FOR EDUCATIONAL PURPOSES.
TO THE BEST OF MARKPLEX CORPORATION’S KNOWLEDGE, ALL OF THE INFORMATION ON THIS PAGE IS CORRECT, AND IT IS PROVIDED IN THE HOPE THAT IT WILL BE USEFUL. HOWEVER, MARKPLEX CORPORATION ASSUMES NO LIABILITY FOR ANY DAMAGES, DIRECT OR OTHERWISE, RESULTING FROM THE USE OF THIS INFORMATION AND/OR PROGRAM(S) DESCRIBED, AND NO WARRANTY IS MADE REGARDING ITS ACCURACY OR COMPLETENESS. USE OF THIS INFORMATION AND/OR PROGRAMS DESCRIBED IS AT YOUR OWN RISK.
ANY EASYLANGUAGE OR POWERLANGUAGE TRADING STRATEGIES, SIGNALS, STUDIES, INDICATORS, SHOWME STUDIES, PAINTBAR STUDIES, PROBABILITYMAP STUDIES, ACTIVITYBAR STUDIES, FUNCTIONS (AND PARTS THEREOF) AND ASSOCIATED TECHNIQUES REFERRED TO, INCLUDED IN OR ATTACHED TO THIS TUTORIAL OR PROGRAM DESCRIPTION ARE EXAMPLES ONLY, AND HAVE BEEN INCLUDED SOLELY FOR EDUCATIONAL PURPOSES. MARKPLEX CORPORATION. DOES NOT RECOMMEND THAT YOU USE ANY SUCH TRADING STRATEGIES, SIGNALS, STUDIES, INDICATORS, SHOWME STUDIES, PAINTBAR STUDIES, PROBABILITYMAP STUDIES, ACTIVITYBAR STUDIES, FUNCTIONS (OR ANY PARTS THEREOF) OR TECHNIQUES. THE USE OF ANY SUCH TRADING STRATEGIES, SIGNALS, STUDIES, INDICATORS, SHOWME STUDIES, PAINTBAR STUDIES, PROBABILITYMAP STUDIES, ACTIVITYBAR STUDIES, FUNCTIONS AND TECHNIQUES DOES NOT GUARANTEE THAT YOU WILL MAKE PROFITS, INCREASE PROFITS, OR MINIMIZE LOSSES.