
Introduction to the Ichimoku Cloud indicator
The Ichimoku Cloud was originally developed by Japanese journalist Goichi Hosoda, starting in the late 1930s, and appeared in his 1969 book. It aims to indicate trend, support and resistance and momentum. Ichimoku is Japanese for “one look.” The indicator includes the following plots:
- Conversion Line is the average/midpoint of the 9-period high and the 9-period low (Tenkan-sen)
- Base Line is the average/midpoint of the 26-period high and the 26-period low (Kijun-sen)
- Leading Span A is the average/midpoint of the Conversion Line and the Base Line plotted 26 periods in the future (Senkou Span A)
- Leading Span B is the average/midpoint of the 52-period high and the 52-period low plotted 26 periods in the future (Senkou Span B)
- Lagging Span is the Close plotted 26 periods in the past (Chikou Span)
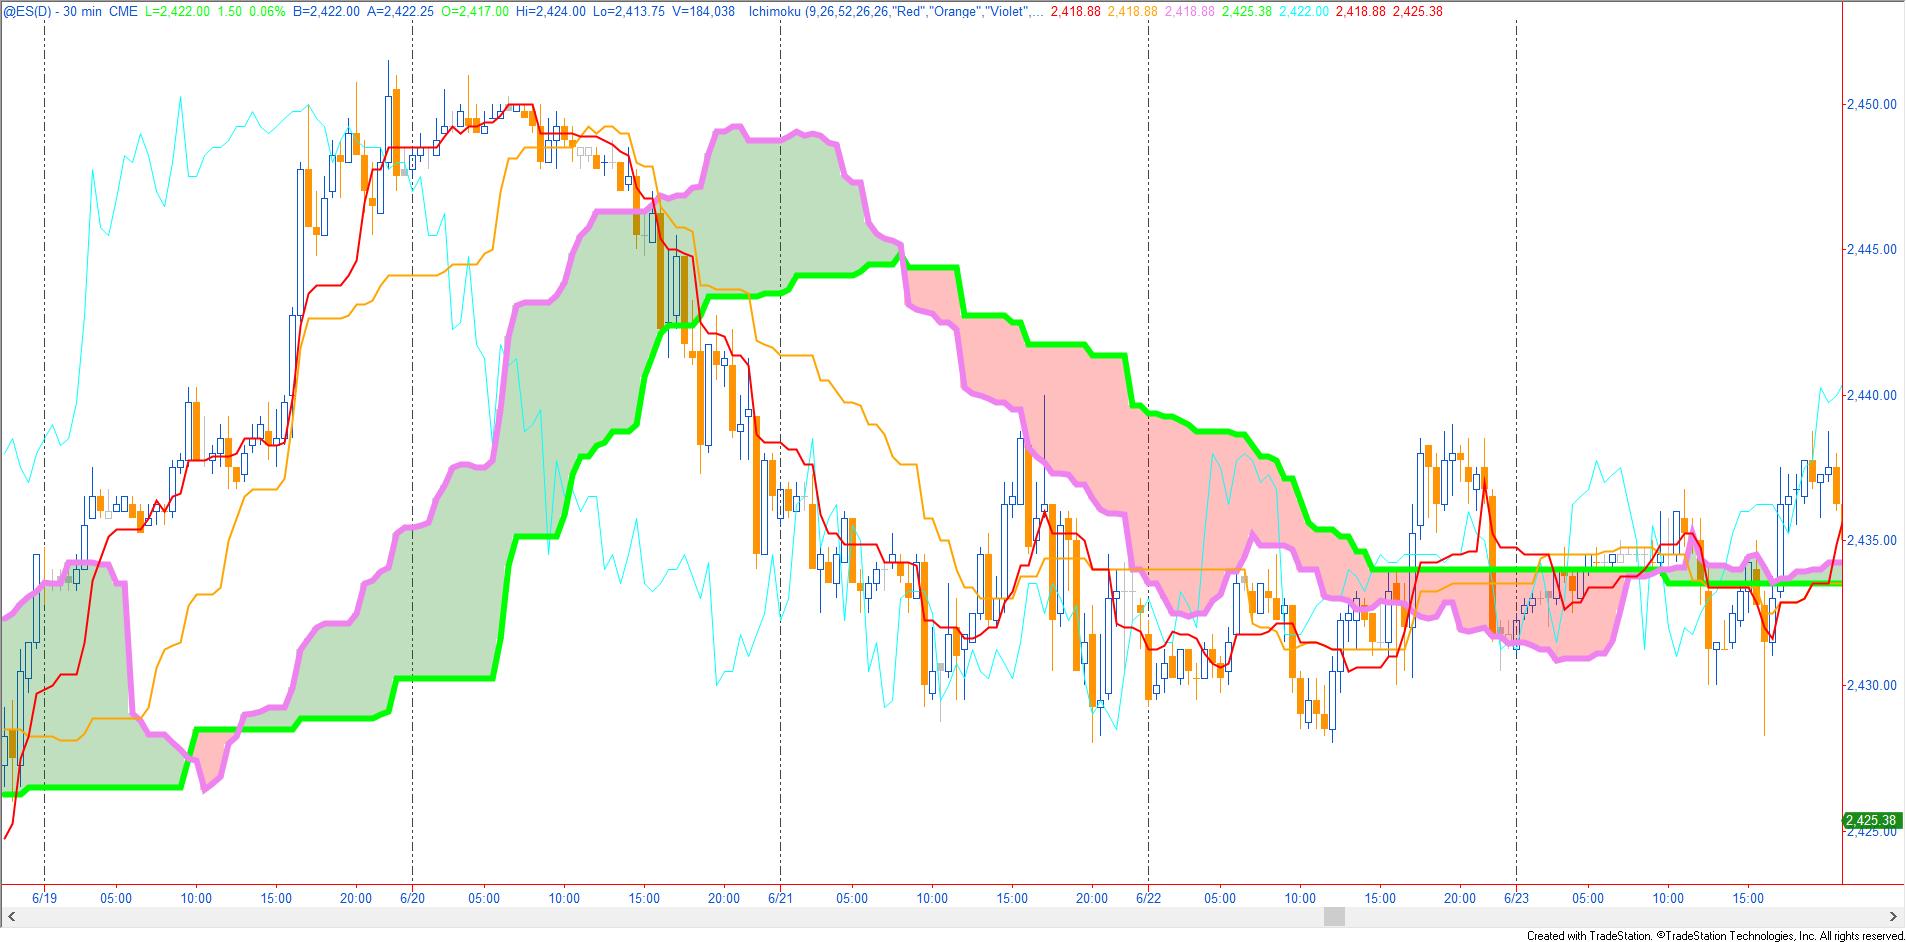
The space between the Leading Span A and the Leading Span B is shaded. It is normally given one color if Leading Span A is above Leading Span B and another if is below.

Determining trend direction
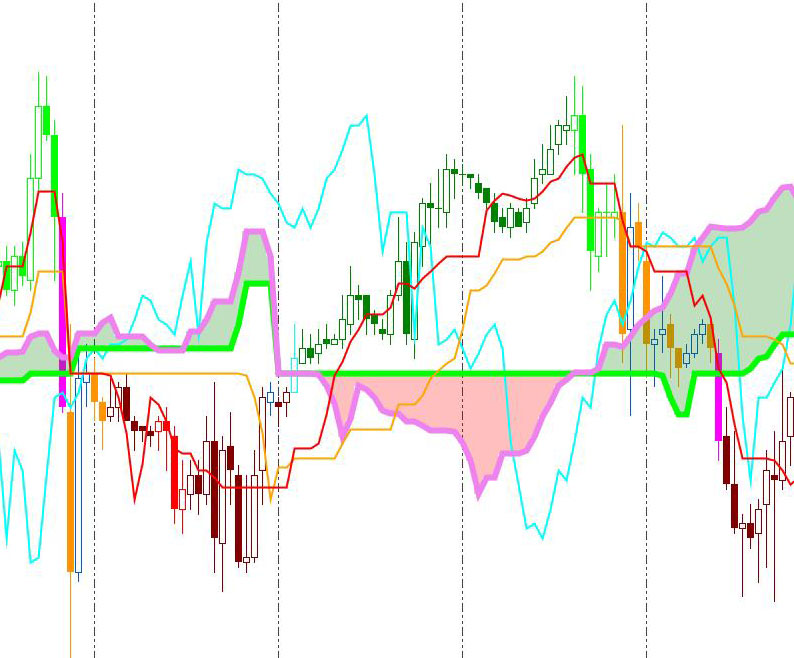
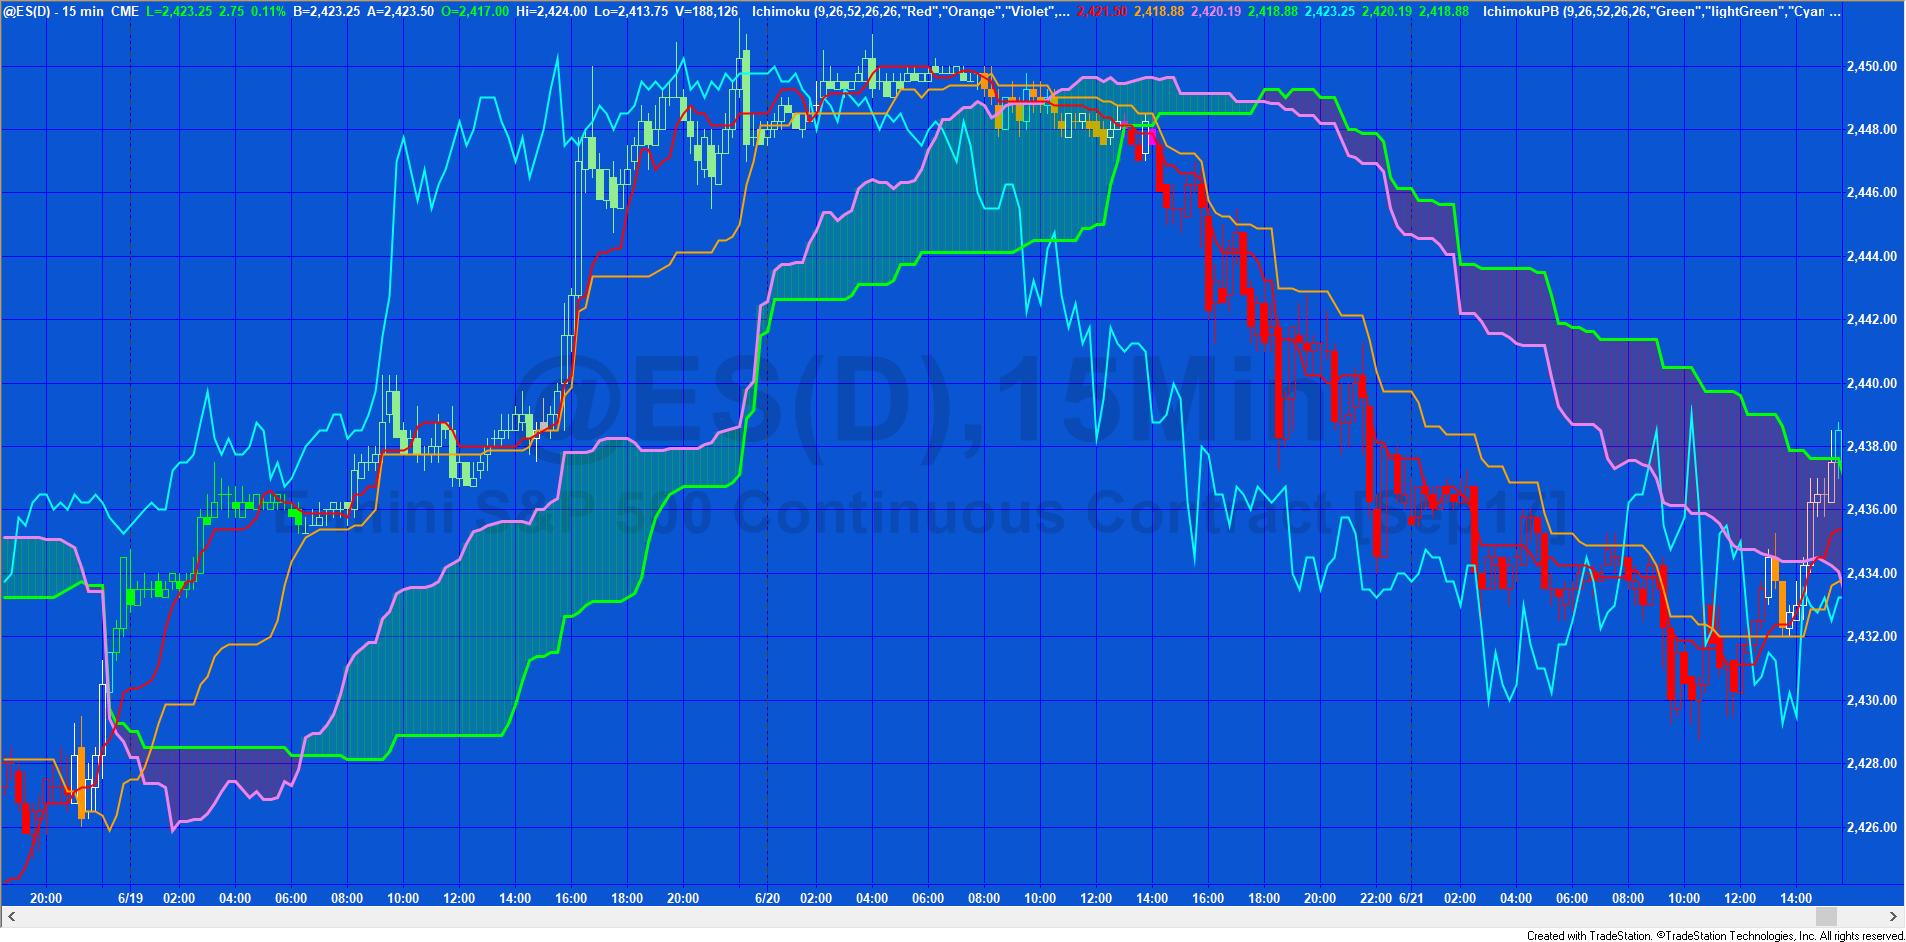
An indication of an up trend is when price is above the cloud. Conversely, an indication of downtrend is when price is below the cloud. This is strengthened if the cloud is the ‘up color’ or the ‘down’ color respectively. In the image to the right the up color is set to green and the down color is set to red.
Determining trend momentum
When the cloud is thin and constantly changing color it indicates market indecision and, perhaps, a weak trend. When the cloud lines move apart it can indicate that the trend is gaining strength.
Price support and resistance
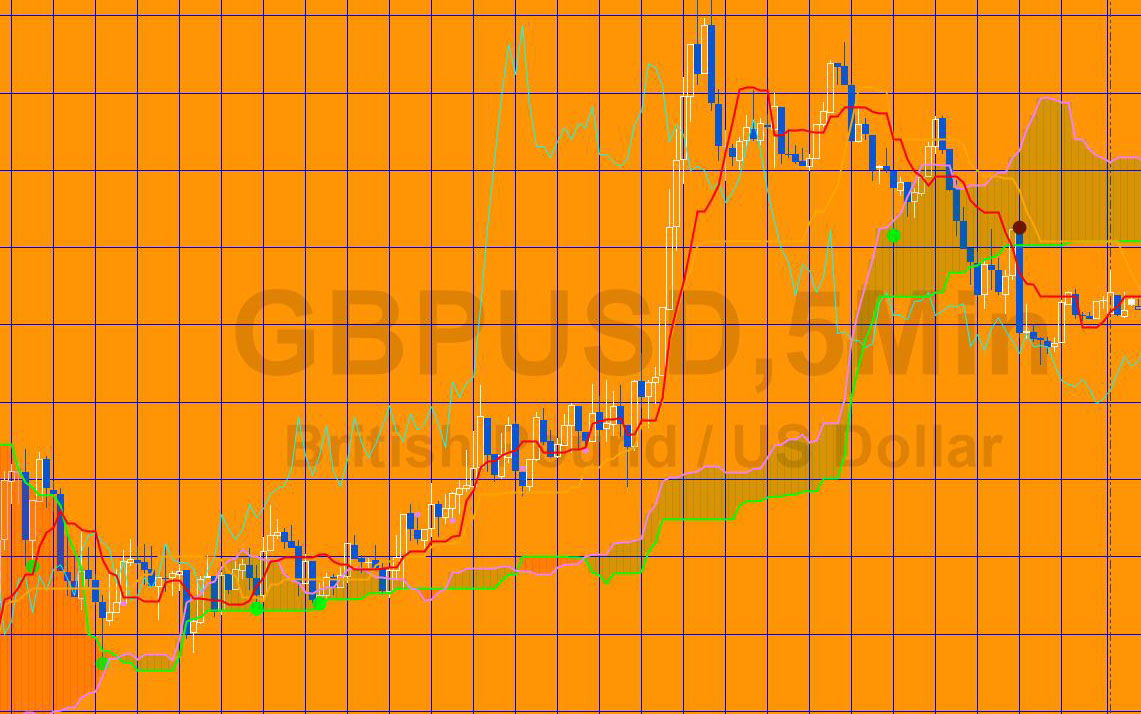
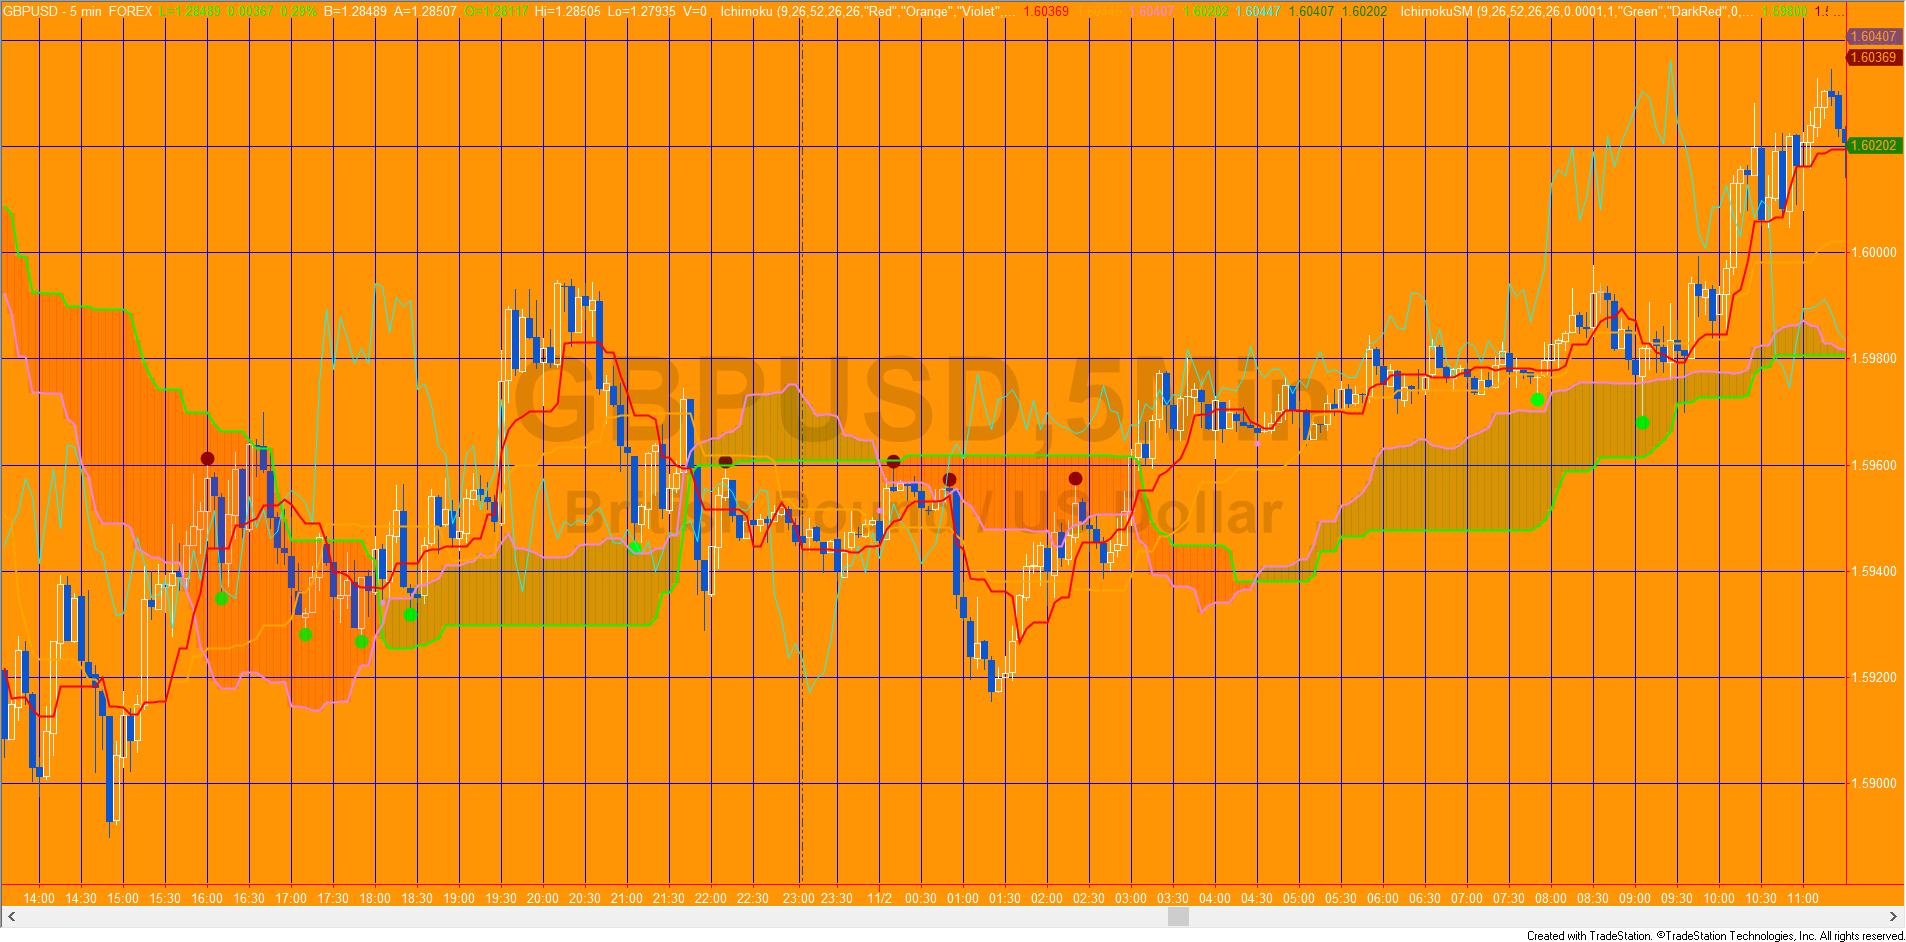
The cloud may provide support for a bullish trend or resistance for a bearish trend. The image shows the Markplex indicator and showme study. The show me dots indicate possible support and resistance.

Potential signals
When the conversion line crosses the base line, this provides a potential signal (especially if it is in line with the trend direction). The image shows potential signals at about 9:40 and 11:00 on the 600 tick @ES chart using _IchimokuSM with the ConvXBase input set to 1.
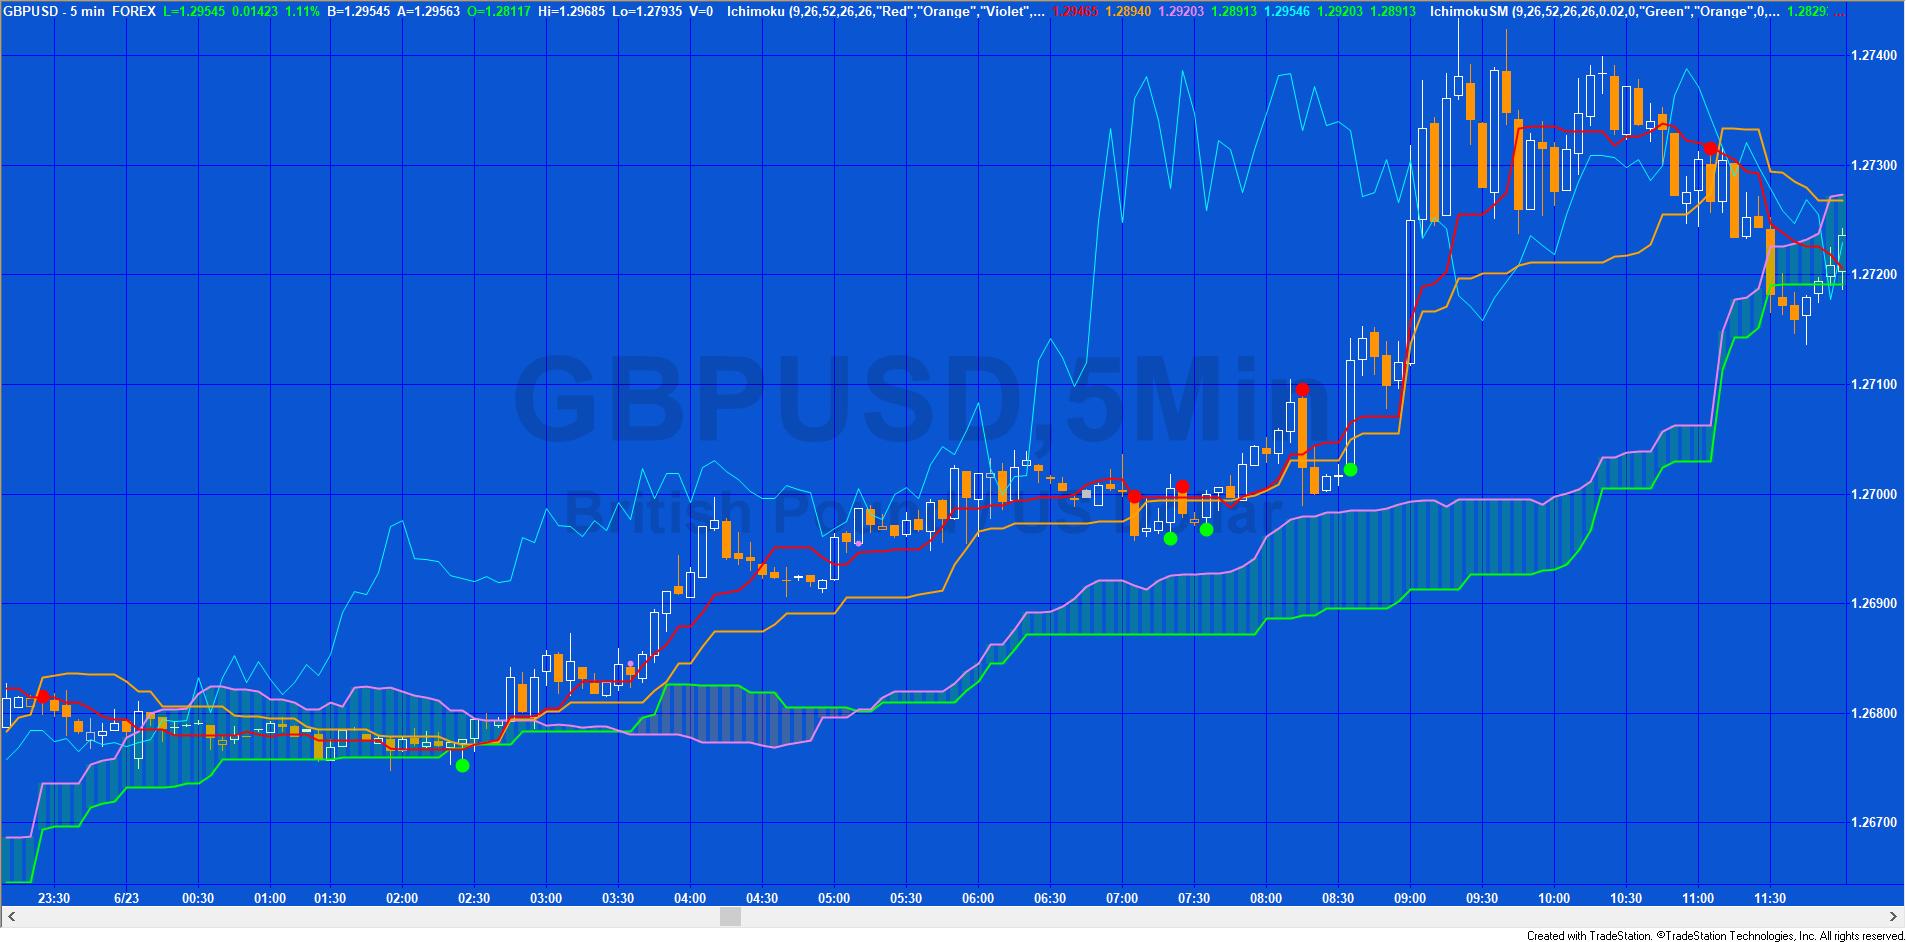
Another potential signal occurs when price crosses the base line. The chart includes the indicator and the show me study: _IchimokuSM with the CXBase input set to 1.
Markplex Ichimoku Cloud Collection
The Markplex Ichimoku Cloud Collection consists of three TradeStation EasyLanguage programs (if you decide to download the programs note that the names begin with an underscore) and a function:
- _Ichimoku – an indicator that plots the Ichimoku lines and the cloud. It is flexible, in that, while certain inputs are often used, the user choose others. The program is simple, designed to be easy to understand and commented throughout.
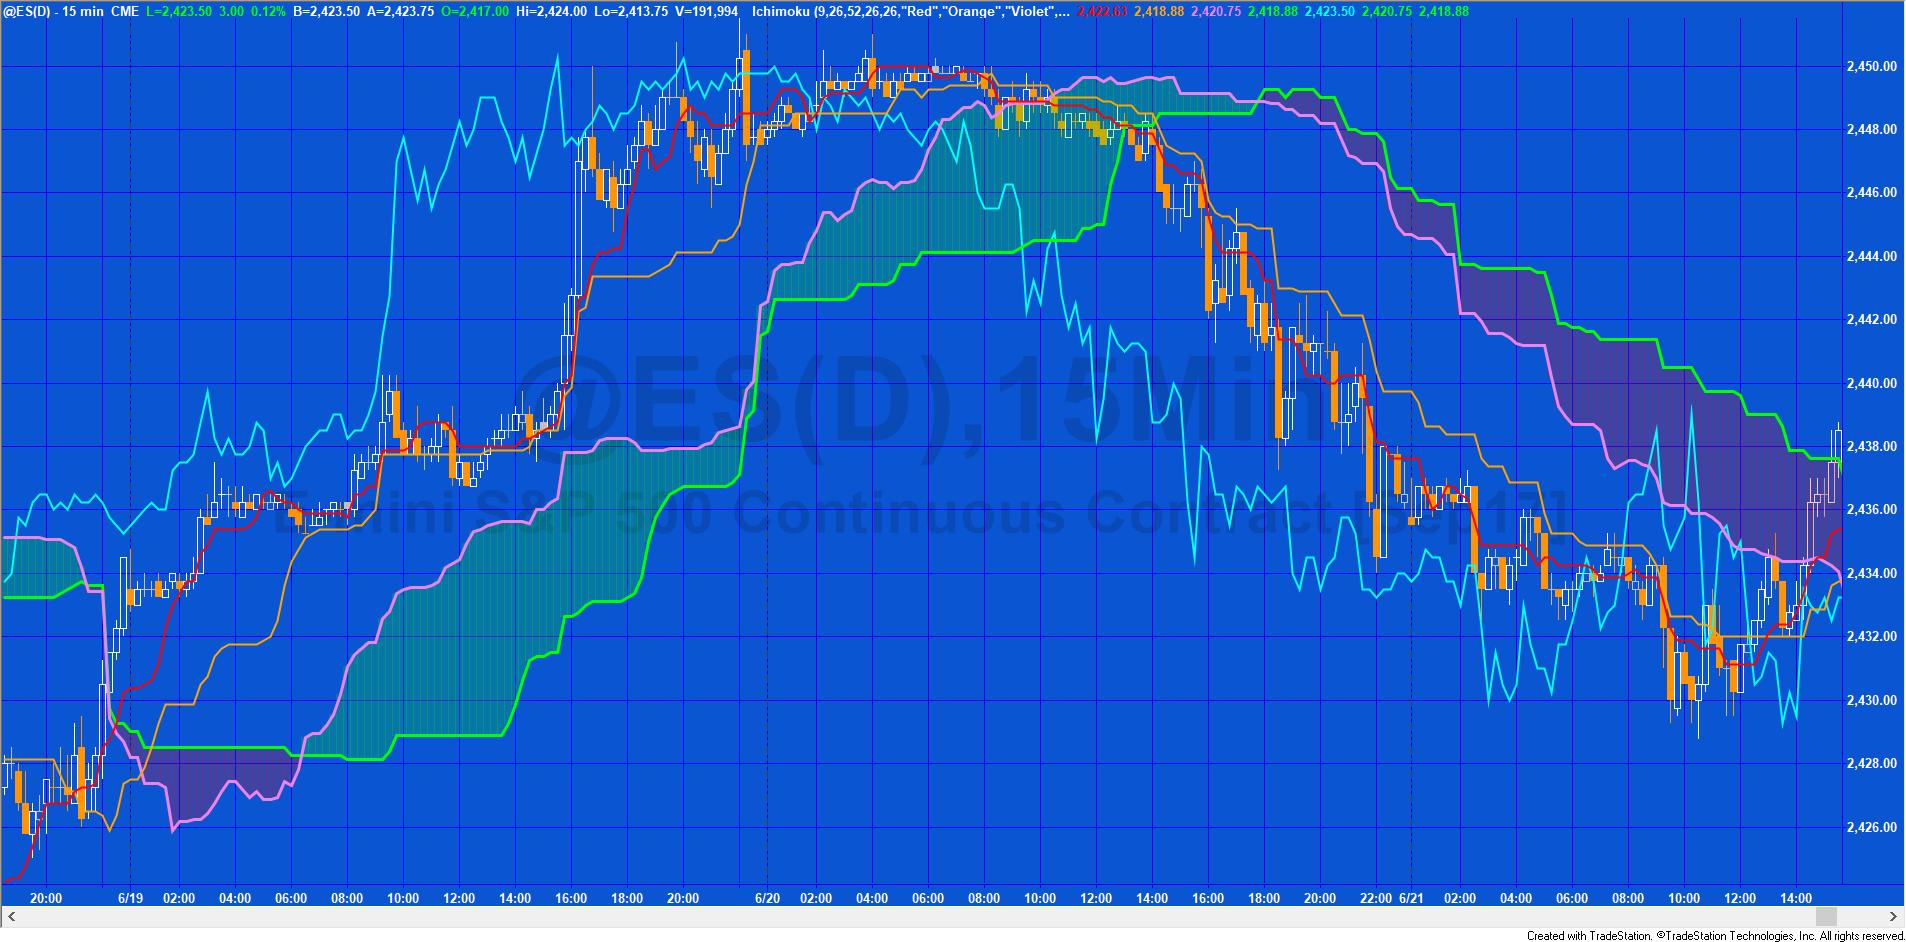
- _IchimokuPB – a paint bar study that varies bar color depending on where price is in relation to the cloud, whether Leading Span A is above or below Leading Span B and when the close crosses out of the cloud. The program includes alerts.
- _IchimokuSM – a show me study that plots when it detects support or resistance in the cloud, when the conversion line crosses the base line, when price crosses base line, when price moves above or below the cloud, and when the cloud changes color. The plots include additional inputs which determine whether they are plotted. The program includes alerts.
- _ColorObjTransparency – a function that takes a color name input and a transparency percentage and returns an RGB value that incorporates the transparency. The function is used by the _Ichimoku indicator.
The programs’ functionality is described in more detail below (including a video). They are designed for TradeStation charting and work with tick, volume, minute, kagi, Kase, three line break, renko and range charts.
After purchase you will be redirected to a download page, so don’t close the browser.
The programs are available for immediate download.
_Ichimoku
- Conversion Line is ( 9-period high + 9-period low ) / 2) (Tenkan-sen)
- Base Line is ( 26-period high + 26-period low ) / 2 ) (Kijun-sen)
- Leading Span A is ( Conversion Line + Base Line ) / 2 ) plotted 26 periods in the future (Senkou Span A)
- Leading Span B is ( 52-period high + 52-period low ) / 2 ) plotted 26 periods in the future (Senkou Span B)
- Lagging Span is the Close plotted 26 days in the past (Chikou Span)
Leading Span A and Leading Span B form the upper and lower boundaries of the ‘cloud’ (although which of them forms the upper and lower boundaries varies depending on which is the highest and lowest respectively). As noted above, Leading Span A and Leading Span B are plotted a user input number of bars into the future. By default this is 26 bars although you can change this number by changing a user input (see the inputs below). The area within the cloud is shaded. The color of the lines and the shaded area can be changed in the user inputs as well as the transparency of the cloud (see the available color below).
The Lagging Span is plotted a user input number of bars in the past. This number is 26 by default.
The style of the lines is controlled by the indicator dialog box. For example, when the indicator is applied to a chart by clicking Format – Analysis Techniques followed by the name of indicator and then selecting the Style tab, it is possible to adjust the style of each line.:
In addition to plotting lines the program can also issue alerts when the following occur:
- Conversion line crosses the base line
- Price crosses the base line
- Price moves above the cloud
- Cloud changes color
In order to activate the alerts, click Format – Analysis Techniques followed by the name of indicator and then selecting the Alerts tab.
Inputs
int ConvLinePeriod( 9 ), // Used to calculate the conversion line ( 9-period high + 9-period low) / 2)
int BaseLinePeriod( 26 ), // Used in the base line calculation ( 26-period high + 26-period low ) / 2
int LeadSpanBPeriod( 52 ), // Used in the Leading Span B calculation
int LeadSpanOffset( 26 ), // LeadingSpanA and LeadingSpanB are plotted this number of bars in the future (default: 26 bars)
int LagSpanOffset( 26 ), // Lagging Span is plotted this number of bars in the past (default: 26 bars)
// Plot colors (colors need to be entered in quotes. For a full list of colors available, see below)
string ConvLineColor( “Red” ),
string BaseLineColor( “Orange” ),
string LeadSpanAColor( “Violet” ),
string LeadSpanBColor( “Green” ),
string LagSpanColor( “Cyan” ),
// Cloud colors
string UpCloudColor( “DarkGreen” ),
string DnCloudColor( “Red” ),
int CloudTransparency( 50 ); // The transparency of the cloud plots are made transparent to enable the price to be seen
Video of the indicator
After purchase you will be redirected to a download page, so don’t close the browser.
_IchimokuPB
_IchimokuPB is a TradeStation paint bar study that displays three bullish paint bars and three bearish paint bars. The calculation of the cloud and other lines is the same as in the indicator although the paint bar has its own independent set of inputs.
Bullish paint bars are painted when the following occur:
- The closing price is greater than the cloud and the conversion line is greater than the base line.
- The closing price is greater than the cloud, it is a bullish cloud (i.e. LeadSpanA[LeadSpanOffset] > LeadSpanB[LeadSpanOffset] ) and the conversion line is greater than the base line.
- The closing price crosses above the cloud.
Bearish paint bars are painted when the following occur:
- The closing price is lower than the cloud and the conversion line is less than the base line.
- The closing price is lower than the cloud, it is a bearish cloud (i.e. LeadSpanA[LeadSpanOffset] < LeadSpanB[LeadSpanOffset] ) and the conversion line is less than the base line.
- The closing price crosses below the cloud.
Alerts are also available when:
- The conversion line crosses base line
- The closing price crosses base line
- The closing price moves above the cloud
- The cloud changes color
Alerts can be switched on in the same way as for the indicator.
Inputs
int ConvLinePeriod( 9 ),
int ConvLinePeriod( 9 ),
int BaseLinePeriod( 26 ),
int LeadSpanBPeriod( 52 ),
int LeadSpanOffset( 26 ),
int LagSpanOffset( 26 ),
// Plot colors
string BullAboveCloud( “DarkGreen” ),
string BullAboveBullCloud( “Green” ),
string BullCloudCross( “Cyan” ),
string BearAboveCloud( “DarkRed” ),
string BearAboveBullCloud( “Red” ),
string BearCloudCross( “Magenta” );
Video of paintbar study
_IchimokuSM
_IchimokuSM is a TradeStation EasyLanguage show me study that plots bullish and bearish showme ‘dots.’ The calculation of the cloud and other lines is the same as in the indicator although _IchimokuSM has its own independent set of inputs and the lines are not plotted.
In contrast with the paint bar study above, this show me study has inputs which determine whether each specific plot is calculated and shown.
- If user input CloudSuppRes is set to 1 the showme study plots a dot when a pivot has occurred within or close to the slide (indicating the the cloud has provided support or resistance. The SuppResAdj input determines how far outside of the cloud that the pivot point can occur and still be considered cloud support or resistance. The color of the dots are determined by user inputs: CloudSupportColor and CloudResColor.
- If the user input ConvXBase is set to 1 the showme study plots a dot when the conversion line crosses above/below the base line. The color of the dots are determined by user inputs: ConvXBaseColorUp and ConvXBaseColorDn.
- If the user input CXBase is set to 1 the showme study plots a dot when the closing price crosses the base line. The color of the dots are determined by user inputs: CXBaseColorUp and CXBaseColorDn.
- If the user input CXCloud is set to 1 the showme study plots a dot when the closing price crosses above or below the cloud. The color of the dots are determined by user inputs: CXCloudColorUp and CXCloudColorDn.
- If the user input Cloud is set to & the showme study plots a dot when the cloud changes color. The color of the dots are determined by user inputs: CloudColorUp and CloudColorDn.
Video of Showme study
Color options
| AliceBlue | DarkSlateGray | LightSalmon | PaleVioletRed |
| AntiqueWhite | DarkTurquoise | LightSeaGreen | PapayaWhip |
| Aqua | DarkViolet | LightSkyBlue | PeachPuff |
| Aquamarine | DeepPink | LightSlateGray | Peru |
| Azure | DeepSkyBlue | LightSteelBlue | Pink |
| Beige | DimGray | LightYellow | Plum |
| Bisque | DodgerBlue | Lime | PowderBlue |
| Black | Firebrick | LimeGreen | Purple |
| BlanchedAlmond | FloralWhite | Linen | Red |
| Blue | ForestGreen | Magenta | RosyBrown |
| BlueViolet | Fuschia | Maroon | RoyalBlue |
| Brown | Gainsboro | MediumAquamarine | SaddleBrown |
| Burlywood | GhostWhite | MediumBlue | Salmon |
| CadetBlue | Gold | MediumOrchid | SandyBrown |
| Chartreuse | Goldenrod | MediumPurple | SeaGreen |
| Chocolate | Gray | MediumSeaGreen | Seashell |
| Coral | Green | MediumSlateBlue | Sienna |
| CornflowerBlue | GreenYellow | MediumSpringGreen | Silver |
| Cornsilk | Honeydew | MediumTurquoise | SkyBlue |
| Cyan | HotPink | MediumVioletRed | SlateBlue |
| DarkBlue | IndianRed | MidnightBlue | SlateGray |
| DarkBrown | Indigo | MintCream | Snow |
| DarkCyan | Ivory | MistyRose | SpringGreen |
| DarkGoldenrod | Khaki | Moccasin | SteelBlue |
| DarkGray | Lavender | NavajoWhite | Tan |
| DarkGreen | LavenderBlush | Navy | Teal |
| DarkKhaki | LawnGreen | OldLace | Thistle |
| Dark Magenta | LemonChiffon | Olive | Tomato |
| DarkOliveGreen | LightBlue | OliveDrab | Turquoise |
| DarkOrange | LightCoral | Orange | Violet |
| DarkOrchid | LightCyan | OrangeRed | Wheat |
| DarkRed | LightGoldenrodYellow | Orchid | White |
| DarkSalmon | LightGray | PaleGoldenrod | WhiteSmoke |
| DarkSeaGreen | LightGreen | PaleGreen | Yellow |
| DarkSlateBlue | LightPink | PaleTurquoise | YellowGreen |
THESE INDICATORS, SHOW ME STUDIES, STRATEGIES AND OTHER PROGRAMS HAVE BEEN INCLUDED SOLELY FOR EDUCATIONAL PURPOSES.
TO THE BEST OF MARKPLEX CORPORATION’S KNOWLEDGE, ALL OF THE INFORMATION ON THIS PAGE IS CORRECT, AND IT IS PROVIDED IN THE HOPE THAT IT WILL BE USEFUL. HOWEVER, MARKPLEX CORPORATION ASSUMES NO LIABILITY FOR ANY DAMAGES, DIRECT OR OTHERWISE, RESULTING FROM THE USE OF THIS INFORMATION AND/OR PROGRAM(S) DESCRIBED, AND NO WARRANTY IS MADE REGARDING ITS ACCURACY OR COMPLETENESS. USE OF THIS INFORMATION AND/OR PROGRAMS DESCRIBED IS AT YOUR OWN RISK.
ANY EASYLANGUAGE OR POWERLANGUAGE TRADING STRATEGIES, SIGNALS, STUDIES, INDICATORS, SHOWME STUDIES, PAINTBAR STUDIES, PROBABILITYMAP STUDIES, ACTIVITYBAR STUDIES, FUNCTIONS (AND PARTS THEREOF) AND ASSOCIATED TECHNIQUES REFERRED TO, INCLUDED IN OR ATTACHED TO THIS TUTORIAL OR PROGRAM DESCRIPTION ARE EXAMPLES ONLY, AND HAVE BEEN INCLUDED SOLELY FOR EDUCATIONAL PURPOSES. MARKPLEX CORPORATION. DOES NOT RECOMMEND THAT YOU USE ANY SUCH TRADING STRATEGIES, SIGNALS, STUDIES, INDICATORS, SHOWME STUDIES, PAINTBAR STUDIES, PROBABILITYMAP STUDIES, ACTIVITYBAR STUDIES, FUNCTIONS (OR ANY PARTS THEREOF) OR TECHNIQUES. THE USE OF ANY SUCH TRADING STRATEGIES, SIGNALS, STUDIES, INDICATORS, SHOWME STUDIES, PAINTBAR STUDIES, PROBABILITYMAP STUDIES, ACTIVITYBAR STUDIES, FUNCTIONS AND TECHNIQUES DOES NOT GUARANTEE THAT YOU WILL MAKE PROFITS, INCREASE PROFITS, OR MINIMIZE LOSSES.