
Overview
Program 7 draws traders pivots levels on a chart based on the high, low, close and or open of a user defined session. Sessions are defined by user inputs which specify the start and end times and the type of traders’ pivots to be calculated. This gives you total control over which period you analyze.
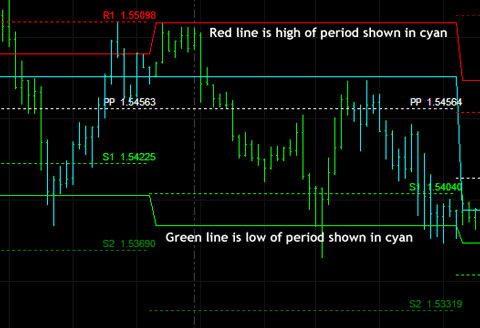
This chart shows is a 30 minute GBP/USD (pound/dollar) chart. The bars highlighted in Cyan are within the period being analyzed (i.e. 0300 – 1100). The upper horizontal red line shows the high of the period, the horizontal green line shows the low of the period and the horizontal cyan line shows the close of the period. These lines are plotted by the indicator and may be turned off using one of the inputs. The program offers three ways of calculating traders’ pivots: Classic, Woodie, and Camarillo. The pivots shown on this chart are calculated using the ‘classic’ formula (see below), based on the high, low and close of the period specified. (The labels: “Red line is high of period shown in cyan” and “green line is low of period shown in cyan” were added in a drawing program)
Pivots are drawn using the following formulae:
Classic Pivots Calculation
R4 = R3 + RANGE (same as: PP + RANGE * 3)
R3 = R2 + RANGE (same as: PP + RANGE * 2)
R2 = PP + RANGE
R1 = (2 * PP) – LOW
PP = (HIGH + LOW + CLOSE) / 3
S1 = (2 * PP) – HIGH
S2 = PP – RANGE
S3 = S2 – RANGE (same as: PP – RANGE * 2)
S4 = S3 – RANGE (same as: PP – RANGE * 3)
Where high, low and close are the high, low and close of the period defined by user input start and end time.
Woodie Pivots Calculation
R4 = R3 + RANGE
R3 = H + 2 * (PP – L) (same as: R1 + RANGE)
R2 = PP + RANGE
R1 = (2 * PP) – LOW
PP = PP = (HIGH + LOW + OPEN + OPEN) / 4
S1 = (2 * PP) – HIGH
S2 = PP – RANGE
S3 = L – 2 * (H – PP) (same as: S1 – RANGE)
S4 = S3 – RANGE
Where high and low are the high and low of the period defined by user input start and end times and open is the open of a new period defined by user input start and end times.
Camarilla Pivots Calculation
R4 = C + RANGE * 1.1/2
R3 = C + RANGE * 1.1/4
R2 = C + RANGE * 1.1/6
R1 = C + RANGE * 1.1/12
PP = (HIGH + LOW + CLOSE) / 3
S1 = C – RANGE * 1.1/12
S2 = C – RANGE * 1.1/6
S3 = C – RANGE * 1.1/4
S4 = C – RANGE * 1.1/2
Where high, low and close are the high, low and close of the period defined by user input start and end time.
The start and end times can be on the same day, or the start time can be on one day and the end time on the next. This might be useful, for example, if you are an Forex trader only interested in a particular part of the day. This could be an official “stock market’ session or a time period that you particularly like to analyze. You might also be interested in a 24 hour period. To do this, enter the start time today, and the end time tomorrow, with a time value one bar less than the start time (see video for more details).
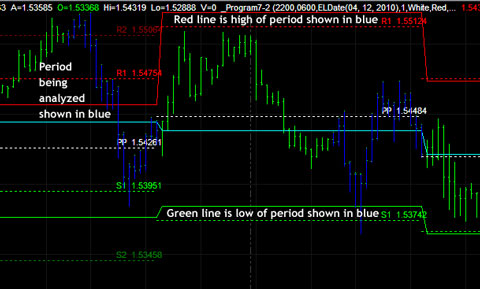
In this example the period being analyzed is shown in blue. The start time is in the previous day (start time = 10:00 p.m. and the end tine is 6:00 a.m.). The horizontal red line shows the high of the period, the horizontal green the low of the period and the horizontal cyan line is close of the period. Classic traders pivots are calculated and drawn using this information. (The labels: “Red line is high of period shown in cyan” and “green line is low of period shown in cyan” were added in a drawing program)
The program may be applied to tick charts or intra-day charts. If a start time is given for which there is no bar, the program will look for the next bar AFTER this time. If an end time is given for which there is no bar, the program will look for the previous bar BEFORE the end time.
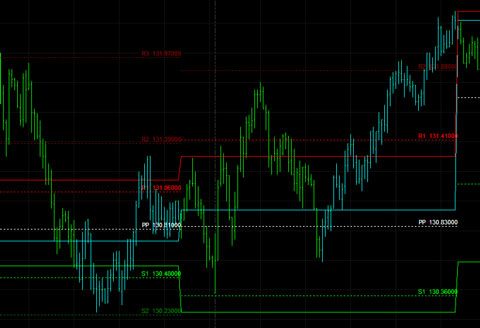 The traders pivots indicator applied to a 500 tick IBM chart. The start time is set at 9:30 and the end time is set at 12:30. Because times vary on tick charts, the first cyan bar, in the image on the left, is time stamped 9:02 and the last cyan bar is time stamped 12:29. For the cyan bars on the right of the image, the first cyan bar is time stamped 9:03 and the last cyan bar is time stamped 12:28.
 The traders pivots indicator applied to a 500 tick IBM chart. The start time is set at 9:30 and the end time is set at 12:30. Because times vary on tick charts, the first cyan bar, in the image on the left, is time stamped 9:02 and the last cyan bar is time stamped 12:29. For the cyan bars on the right of the image, the first cyan bar is time stamped 9:03 and the last cyan bar is time stamped 12:28.
This unprotected and commented program (i.e. the Tradestation EasyLanguage indicator) is available for immediate download for $49.95 by clicking the ‘add to cart’ button to pay using a credit card or PayPal.
The program was developed in TradeStation 8.7 (and so is compatible with versions 8.7 and above, including 9.1 and MultiCharts) and works with intraday and tick charts.
This indicator uses some of the functionality developed in tutorial 45 . You may find that the information in this link is useful when trying to understand the program..
This unprotected and commented program (i.e. the Tradestation EasyLanguage indicator) is available for immediate download for $49.95 by clicking the ‘add to cart’ button to pay using a credit card or PayPal.
The program was developed in TradeStation 8.7 (and so is compatible with versions 8.7 and above, including 9.1 and MultiCharts) and works with intraday and tick charts.
Video demonstration of program 7 – configurable traders’ pivots program
Program inputs
StartTime( 0900 ), // Start time of period
EndTime( 1600 ), // End time of period
DatetoStart( ELDate(04, 14, 2010) ), // Enter date to start calculating high/lows and pivots as ELDate(04, 14, 2010) or 1100414
// Enter 0 to start from beginning of chart
// If EndTime > StartTime then same day, if EndTime < StartTime then Starttime is one day, EndTime the next
PivotType( 1 ), {1 = Classic, 2 = Woodie, 3 = Camarilla}
PPcolor( White ), // PP color
R1color( Red ), // R1 color
R2color( DarkRed ), // R2 color
R3color( DarkRed ), // R3 color
R4color( DarkRed ), // R4 color
S1color( Green ), // S1 color
S2color( DarkGreen ), // S2 color
S3color( DarkGreen ), // S3 color
S4color( DarkGreen ), // S4 color
ShowHiLoClose( TRUE ), // Determines whether indicator lines showing high, low and close of period are drawn
DecPlaces( 2 ), // The number of decimal places displayed on the Pivot levels
TestCalc( TRUE ), // If TRUE prints in the EasyLanguage Output Bar – Print Log: high, low, close of period and/or open of period and PP calculation
OutputofInputs( TRUE ); // If TRUE prints in Print Log inputs
This unprotected and commented program (i.e. the Tradestation EasyLanguage indicator) is available for immediate download for $49.95 by clicking the ‘add to cart’ button to pay using a credit card or PayPal.
The program was developed in TradeStation 8.7 (and so is compatible with versions 8.7 and above, including 9.1) and works with intraday and tick charts.
If you would prefer to pay be check, please make a check payable to Billy Fire LLC and mail to 14781 Pomerado Road, #110, Poway CA 92064 together with a valid email address. I will email download instructions to you.
The program is ‘unprotected,’ in other words, you will be able to see and edit the program.
Please email any bugs that you may discover to support@markplex.com.
TO THE BEST OF MARKPLEX CORPORATION’S KNOWLEDGE, ALL OF THE INFORMATION ON THIS PAGE IS CORRECT, AND IT IS PROVIDED IN THE HOPE THAT IT WILL BE USEFUL. HOWEVER, MARKPLEX CORPORATION ASSUMES NO LIABILITY FOR ANY DAMAGES, DIRECT OR OTHERWISE, RESULTING FROM THE USE OF THIS INFORMATION AND/OR PROGRAM(S) DESCRIBED, AND NO WARRANTY IS MADE REGARDING ITS ACCURACY OR COMPLETENESS. USE OF THIS INFORMATION AND/OR PROGRAMS DESCRIBED IS AT YOUR OWN RISK.
ANY EASYLANGUAGE OR POWERLANGUAGE TRADING STRATEGIES, SIGNALS, STUDIES, INDICATORS, SHOWME STUDIES, PAINTBAR STUDIES, PROBABILITYMAP STUDIES, ACTIVITYBAR STUDIES, FUNCTIONS (AND PARTS THEREOF) AND ASSOCIATED TECHNIQUES REFERRED TO, INCLUDED IN OR ATTACHED TO THIS TUTORIAL OR PROGRAM DESCRIPTION ARE EXAMPLES ONLY, AND HAVE BEEN INCLUDED SOLELY FOR EDUCATIONAL PURPOSES. MARKPLEX CORPORATION. DOES NOT RECOMMEND THAT YOU USE ANY SUCH TRADING STRATEGIES, SIGNALS, STUDIES, INDICATORS, SHOWME STUDIES, PAINTBAR STUDIES, PROBABILITYMAP STUDIES, ACTIVITYBAR STUDIES, FUNCTIONS (OR ANY PARTS THEREOF) OR TECHNIQUES. THE USE OF ANY SUCH TRADING STRATEGIES, SIGNALS, STUDIES, INDICATORS, SHOWME STUDIES, PAINTBAR STUDIES, PROBABILITYMAP STUDIES, ACTIVITYBAR STUDIES, FUNCTIONS AND TECHNIQUES DOES NOT GUARANTEE THAT YOU WILL MAKE PROFITS, INCREASE PROFITS, OR MINIMIZE LOSSES.