
Analysis of multiple time frame averages
The objective of the program is to change the color and thickness of the simple average of price to indicate a bearish, or bullish bias or congestion based on analysis of several time series moving averages and their position relative to each other. The program is unprotected and available for immediate download so that you can modify it to your own needs.
Program 71 uses the Price Series Provider class to calculate and plot simple moving averages for 6 different user specified time series. The intervals for the time series are specified in minutes, for example program 71’s defaults are: 15 minutes, 30 minutes, 60 minutes, 120 minutes, 240 minutes, and 480 minutes. Simple moving averages are calculated for the symbol on the chart (I have used a 5 minute interval for most of the examples on this page) as well as for the time series and these are plotted on the chart.

The moving average lines are plotted on the chart and so their style and color can be modified in the Format Analysis technique settings. The color and thickness of the moving average of the price is controlled by analysis within the program. The average lines can be analyzed in two ways, based on a user input:
Technique 1: Analyze the price series moving averages to see if the longer or shorter averages tend to be the highest (or lowest)
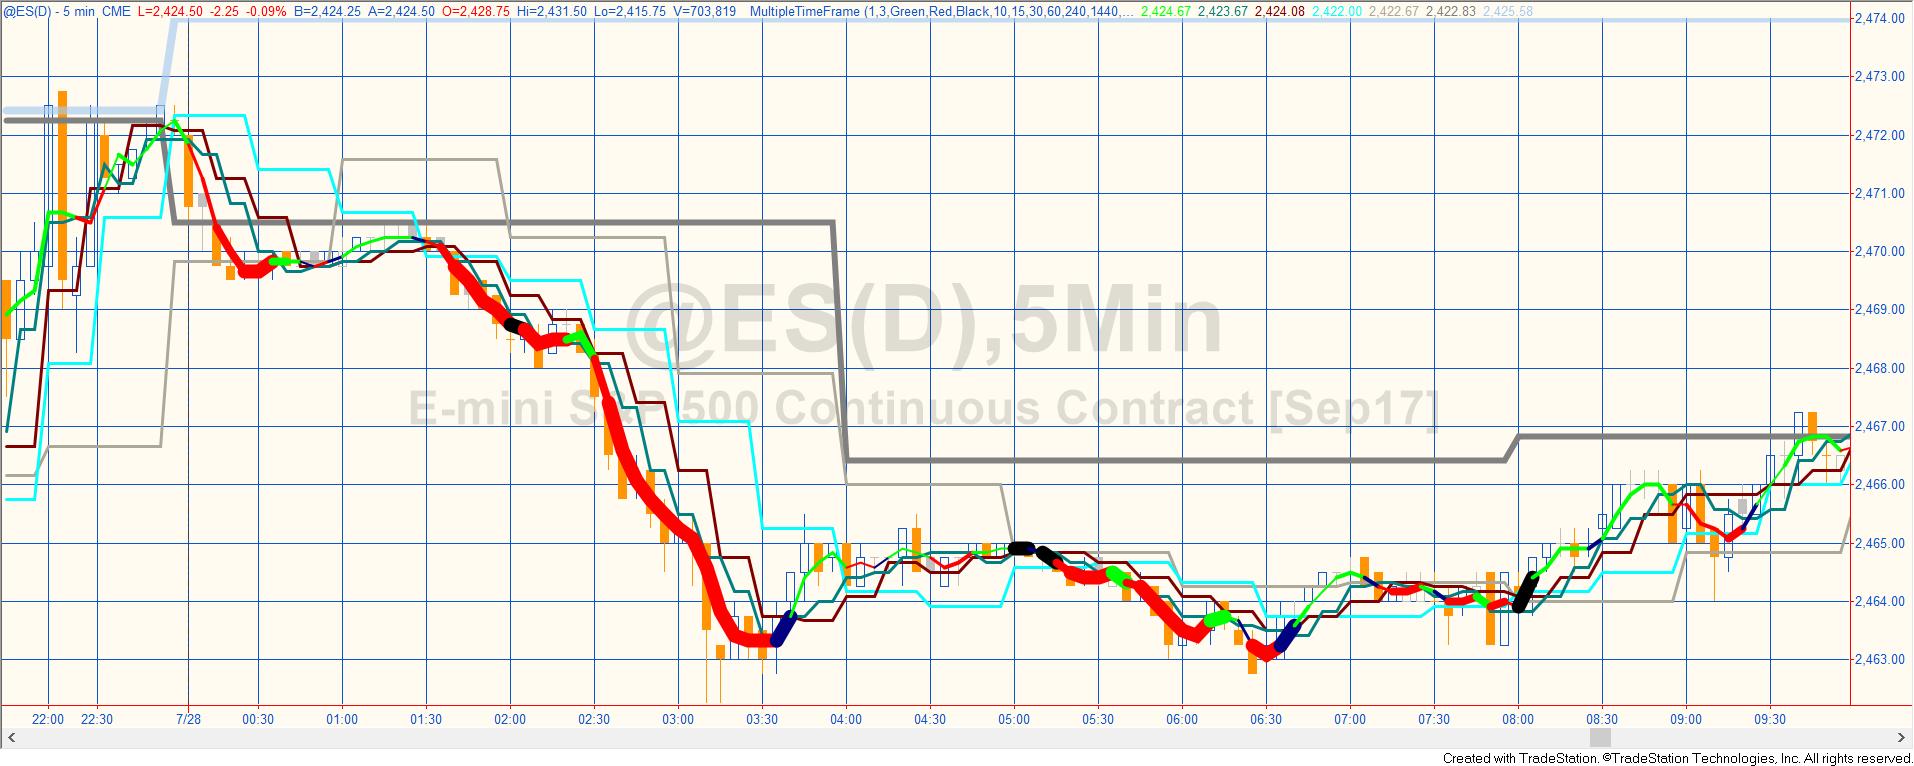
With technique 1 the program analyses the price series moving averages to see where the price average ranks in relation to the PSP simple moving averages (SMAs). If the price moving average is the highest or within the top 4 averages and the slope of the price line over 4 bars is greater than zero, this is seen as a bullish indication. If the price SMA are lowest or within the bottom 4 averages, and the slope of the price line over 4 bars is less than zero, this is seen as a bearish indication. The line is drawn thicker if the price moving average is nearer the extremes.
The color of the price line is based on a 2 period simple moving average of the price. If the slope is positive the line is plotted with a color defined by user input BullCol, if the slope is negative, the line is plotted as defined by BearCol.
If the distance between the moving averages for the shortest price intervals is narrowing more than user input Narrowing – 1 (i.e. the current smallest distance is less than that for the previous Narrowing – 1 bars) the thickness of the line is set to 6 and the color to user input: CongesCol.
Technique 2: Counting the last change in the price and price series providers
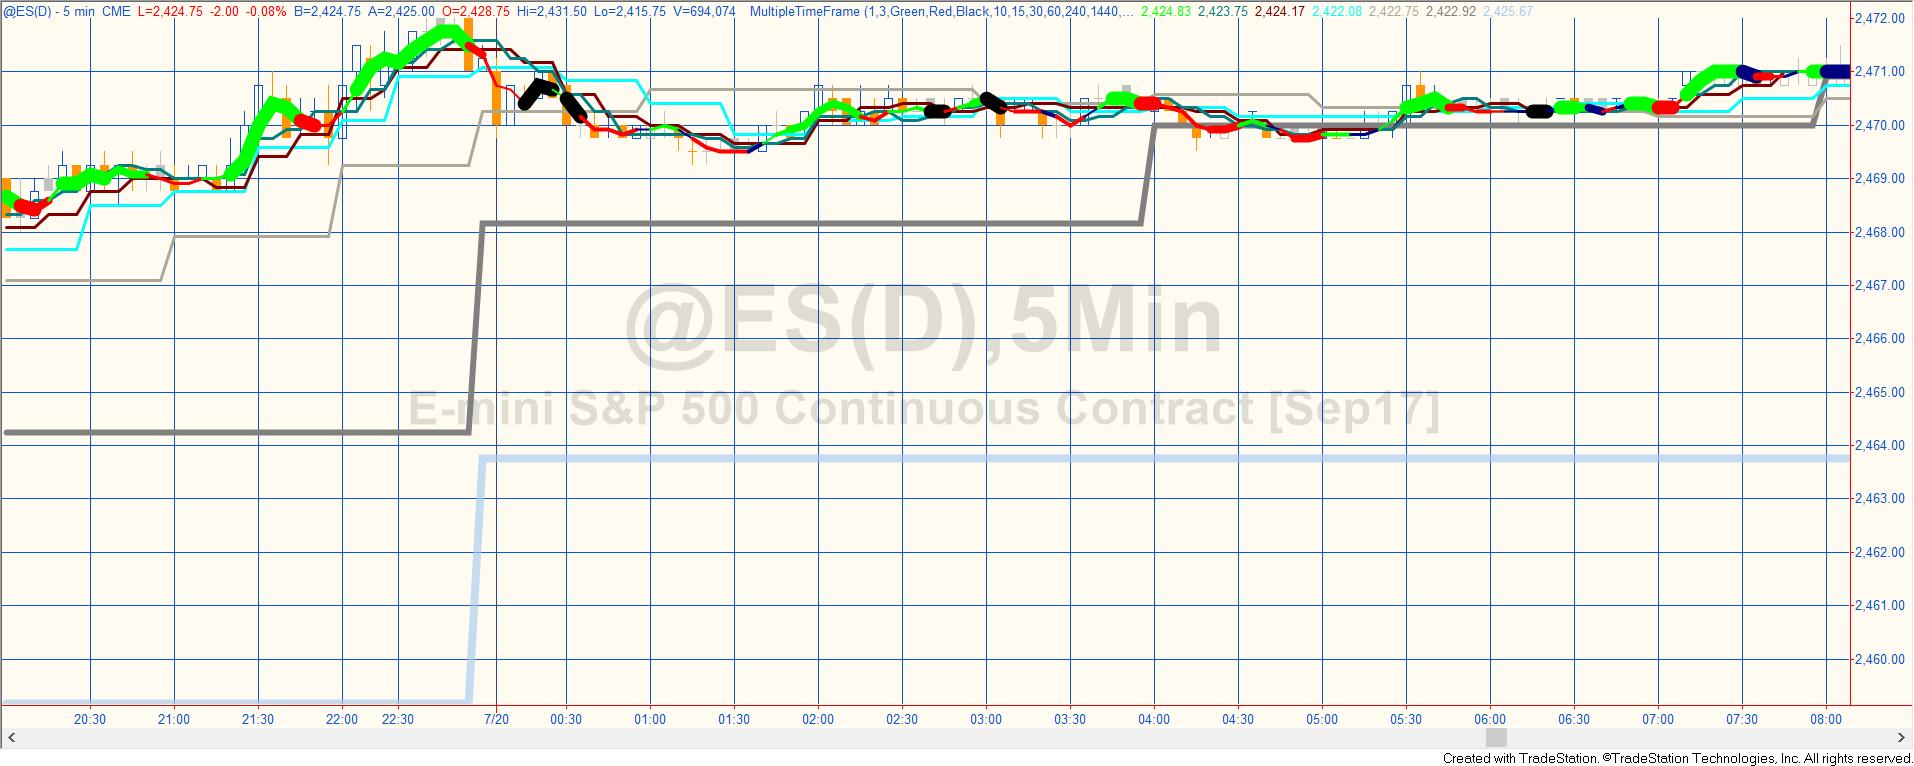
With technique 2 the program increments a bear counter such if the last change (compared to the previous bar) for for the price or each of the PSPs was up, the bear counter is incremented by 1. For example, if the last change in price ( Close – Close[1]) was positive, the bull counter would be incremented by 1. If in addition to price of one of the PSPs was greater than the previous PSP value, the bull counter would be incremented by another 1 etc.
The color of the price line is based on a 2 period simple moving average of the price. If the slope is positive the line is plotted with a color defined by user input BullCol, if the slope is negative, the line is plotted as defined by BearCol.
The thickness of the price line is determined by the value of the bull counter.
Similarly, the bear counter is incremented by one when the price this bar is LESS than the price last bar (and the same for the PSPs).
As with technique 1, if the distance between the moving averages for the shortest price intervals is narrowing more than user input Narrowing – 1 (i.e. the current smallest distance is less than that for the previous Narrowing – 1 bars) the thickness of the line is set to 6 and the color to user input: CongesCol.
User inputs
int Technique( 1 ), // 1 = highest average or lowest average, 2 = averages rising/falling
int MALen( 3 ), // Length of price and price series provider moving averages
int BullCol( Green ), // Colors price average (plot1) deemed to be bullish according to the specific technique
int BearCol( Red ), // Colors price average (plot1) deemed to be bearish according to the specific technique
int CongesCol( Black ), // Congestion color
int Interval1( 15 ), // Interval in minutes for the first time period (should be shortest time frame)
int Interval2( 30 ), // Interval in minutes for the second time period (should be second shortest time frame)
int Interval3( 60 ), // Interval in minutes for the third time period (should be third shortest time frame)
int Interval4( 120 ), // Interval in minutes for the fourth time period (should be fourth shortest time frame)
int Interval5( 240 ), // Interval in minutes for the fifth time period (should be fifth shortest time frame)
int Interval6( 480 ), // Interval in minutes for the sixth time period (should be the longest time frame)
int Narrowing( 5 ); // How many bars back to look for ‘narrowing.’ See NarrowRge method below.
- Price series provider (PSP) creation method (useful when you wish to create a large number of price series providers)
- Automatically create PSP objects with their first date set to the datetime of the first bar on the chart
- Automatically detect whether the chart is using local or exchange time
- Method to gauge narrowing of average bands
- Create and sort a two dimensional array
- Modify plot style (thickness) and color
Program download
The UNPROTECTED indicator (i.e. the TradeStation EasyLanguage is fully functional and you can see the source code) is available for for IMMEDIATE download for $49- by clicking the ‘add to cart’ button.
After download the program can be opened, you will be able to see the program code and modify it. After purchase you will be redirected to a download page, so don’t close the browser.
If you are a Gold Pass member make sure you enter the special coupon code to get 20% discount off these prices. Also, be sure to watch the bonus Gold Pass video below.