
Raff linear regression channel
Program 75 is a TradeStation EasyLanguage indicator that plots and/or draws a Raff linear regression channel on a chart
Many linear regression channels base the height of the channel on a calculation of standard deviations. A Raff linear regression channel bases the height of the channel on the price that is furthest away from the linear regression line in the channel. This is illustrated in the following image.
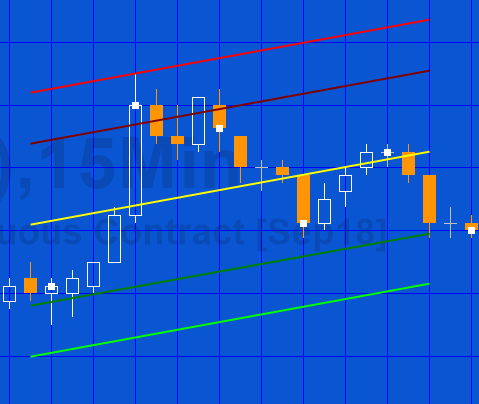
In the above image (measuring the distance between the line and the highs and the line and the lows). The high of the 6th bar from the start of the channel is the greatest distance for all the bars in the channel. The upper and lower lines of the channel are moved to be this distance from the center line parallel to the linear regression line. The additional lines drawn between the extremes and drawn a 61.8% of the distance, representation a Fibonacci level.
In addition to the way the program uses the Raff technique to determine how high the channel is (rather than a multiple of standard deviation), it also allows the user to create a channel that ends at a specific bar, by clicking on that bar. The program detects the bar click and redraws the channel.
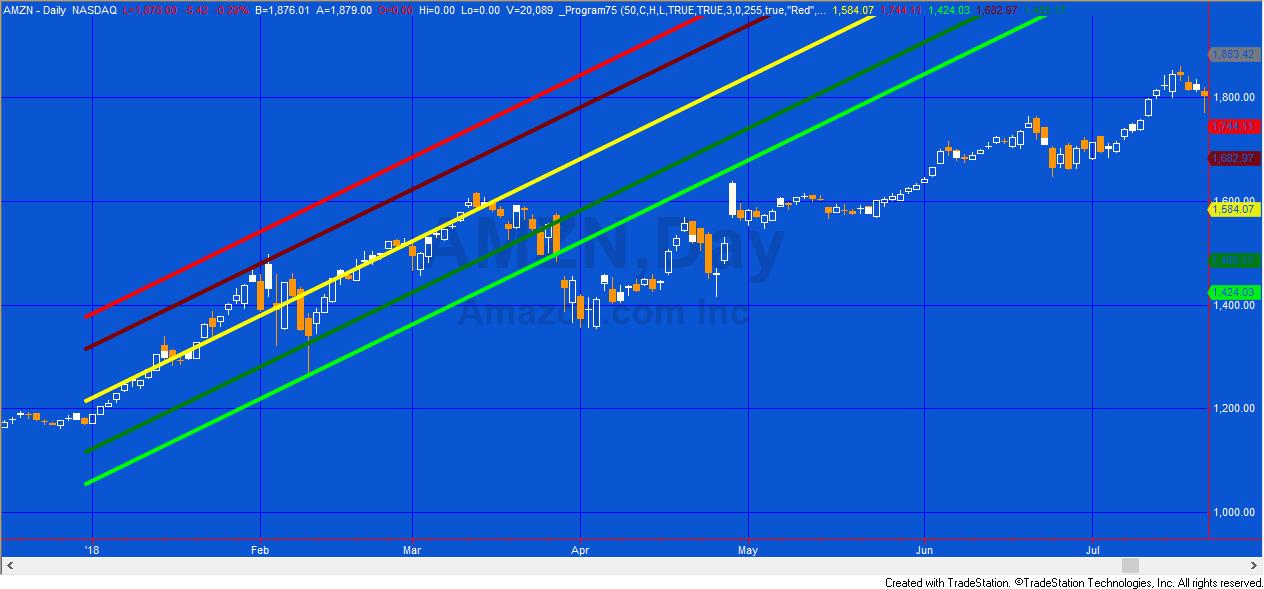
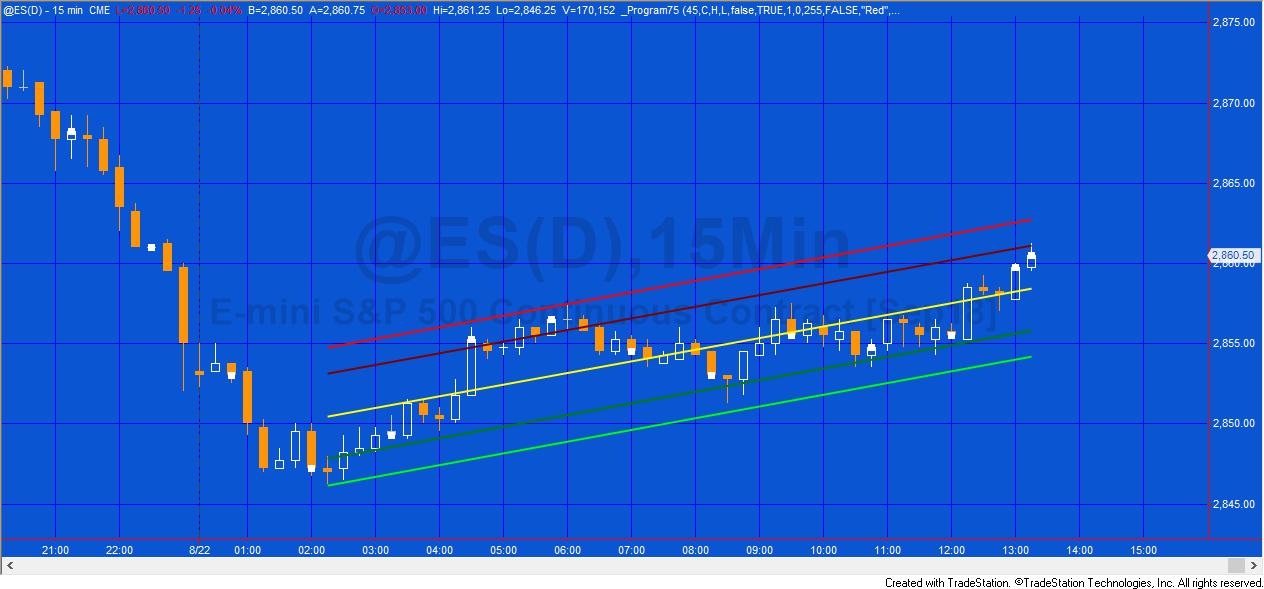
 A further innovation is to also create the channels using the plot statement. This creates a record of where previous channels were drawn, as in the following image. Whether lines are drawn or plotted is controlled by user inputs: Plots and DrawLines. When the chart is refreshed, inputs modified or turned off and on, the plots and lines disappear.
Video demonstration of program 75 Part 1 | introduction and using on a chart
Video demonstration of program 75 Part 2 | maxbarsback settings
Program setup
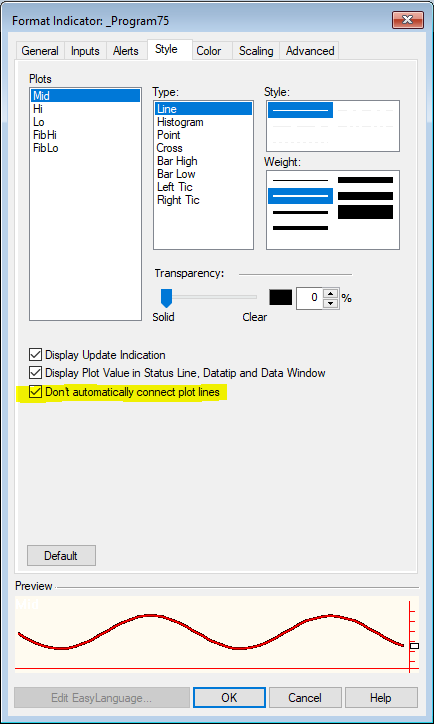
 Make sure that in the indicator options for each plot, the “Don’t automatically connect plot lines” option is checked. If not the chart will appear something like the following:
The following screen shows the styling options for plots:
Maxbarsback options
In the general tab for format indicator you have two options:
- Use auto-detect
- Specify a number using the user defined option
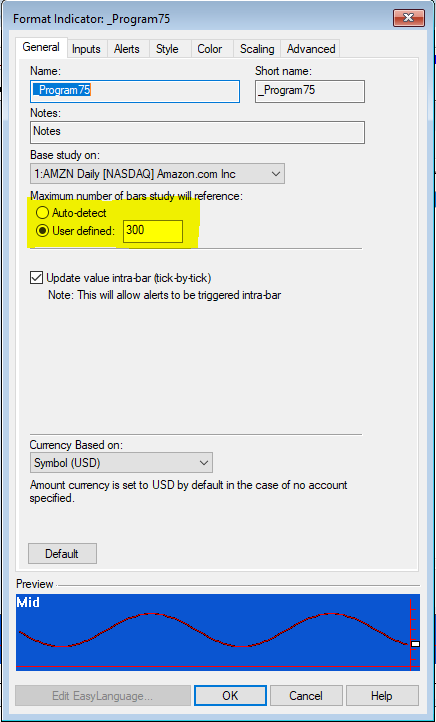
If you specify the value you will generate an error if you click a bar which is greater than this number of bars from the end of the chart. If you select auto-detect, the chart will reload every time that you click a bar earlier than a bar you have already clicked. The technical reason for this behavior is discussed below.
Inputs
int NumBars( 20 ), // The number of bars to consider when calculating the linear regression
double Price( C ), // The price to consider when calculating the linear regression
double UPrice( H ), // The price used to determine the biggest ‘distance’ above the linear regression line for bars above the linear regression line
double LPrice( L ), // The price used to determine the biggest ‘distance’ below the linear regression line for bars below the linear regression line
bool Plots( TRUE ), // Plot the linear regression channel
bool DrawLines( TRUE ), // Use drawing tools to draw the linear regression channel
// Trendline drawing objects attributes
int TLWeight( 3 ), // Determines the thickness of the trendline. Valid numbers are integers between 0 and 6
int TLStyle( 0 ), // 0 = solid, 1 = dashed, 2 = dotted, 3 = dashed2, 4 = dashed3
int TLTransparency( 255 ), // Sets the alpha component (transparency) of this color structure, where 0 is fully transparent and 255 is fully opaque
bool TLExtRight( FALSE ), // Extend the TL lines drawn to the right
string TopColor( “Red” ), // The color of the top regression channel line or plot
string FibUColor( “DarkRed” ), // The color of the top Fibonnacci regression channel line or plot
string MidColor( “Yellow” ), // The color of the middle regression channel line or plot
string FibLColor( “DarkGreen” ), // The color of the lower Fibonacci regression channel line or plot
string LowColor( “Green” ); // The color of the lower regression channel line or plot
Color options
| AliceBlue | DarkSlateGray | LightSalmon | PaleVioletRed |
| AntiqueWhite | DarkTurquoise | LightSeaGreen | PapayaWhip |
| Aqua | DarkViolet | LightSkyBlue | PeachPuff |
| Aquamarine | DeepPink | LightSlateGray | Peru |
| Azure | DeepSkyBlue | LightSteelBlue | Pink |
| Beige | DimGray | LightYellow | Plum |
| Bisque | DodgerBlue | Lime | PowderBlue |
| Black | Firebrick | LimeGreen | Purple |
| BlanchedAlmond | FloralWhite | Linen | Red |
| Blue | ForestGreen | Magenta | RosyBrown |
| BlueViolet | Fuschia | Maroon | RoyalBlue |
| Brown | Gainsboro | MediumAquamarine | SaddleBrown |
| Burlywood | GhostWhite | MediumBlue | Salmon |
| CadetBlue | Gold | MediumOrchid | SandyBrown |
| Chartreuse | Goldenrod | MediumPurple | SeaGreen |
| Chocolate | Gray | MediumSeaGreen | Seashell |
| Coral | Green | MediumSlateBlue | Sienna |
| CornflowerBlue | GreenYellow | MediumSpringGreen | Silver |
| Cornsilk | Honeydew | MediumTurquoise | SkyBlue |
| Cyan | HotPink | MediumVioletRed | SlateBlue |
| DarkBlue | IndianRed | MidnightBlue | SlateGray |
| DarkBrown | Indigo | MintCream | Snow |
| DarkCyan | Ivory | MistyRose | SpringGreen |
| DarkGoldenrod | Khaki | Moccasin | SteelBlue |
| DarkGray | Lavender | NavajoWhite | Tan |
| DarkGreen | LavenderBlush | Navy | Teal |
| DarkKhaki | LawnGreen | OldLace | Thistle |
| Dark Magenta | LemonChiffon | Olive | Tomato |
| DarkOliveGreen | LightBlue | OliveDrab | Turquoise |
| DarkOrange | LightCoral | Orange | Violet |
| DarkOrchid | LightCyan | OrangeRed | Wheat |
| DarkRed | LightGoldenrodYellow | Orchid | White |
| DarkSalmon | LightGray | PaleGoldenrod | WhiteSmoke |
| DarkSeaGreen | LightGreen | PaleGreen | Yellow |
| DarkSlateBlue | LightPink | PaleTurquoise | YellowGreen |
Technical lessons
Program 75 uses the following programming techniques and syntax:
- The Chartinghost object to detect when a bar is clicked and to provide information on that bar
- Drawing objects (BNPoint and Trendline) are used to draw the channel lines
- The plot command to plot the channel lines
- Using strings to designate both plot and trendline colors
- The linear regression calculation
Drawing objects
To draw lines with the TradeStation drawing objects we create a pair of BNPoint objects using a bar number and price. The trend line is created and styled and then added to the chart.
Two potential ‘gotchas’
Gotcha 1
A BNPoint refers to the absolute bar index (zero-based) of the collection of bars in a chart. This is not the same as the BarNumber function or CurrentBar reserved word which count the number of bars available for analysis after MaxBarsBack. So to create a BNPoint for the current bar (BarNumber) would be:
NewBar = BarNumber + MaxBarsBack – 1;
Gotcha 2
Another issue that can cause what appear to be spurious results are the ‘Show empty daily trading periods for traditional chart types’ and ‘Show empty intraday session periods for traditional chart types’ settings. These can be found by clicking View – Chart Analysis Preferences
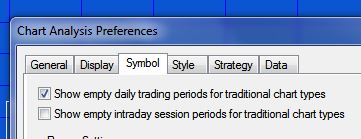
If these are selected, the chart includes blank bars which ‘confuse’ the bar number for BNPoints. The ‘Show empty daily trading periods for traditional chart types’ and ‘Show empty intraday session trading periods for traditional chart types’ must be deselected.
Program download
Program 75 was developed for TradeStation 9.5 and above and is not compatible with MultiCharts because of the objects used.
An UNPROTECTED version (i.e. the TradeStation EasyLanguage is fully functional and you can see the source code) and associated unprotected function is available for for IMMEDIATE download for $29- by clicking the ‘add to cart’ button. After download the program can be opened, you will be able to see the program code and modify it.
After purchase you will be redirected to a download page, so don’t close the browser. You will also receive an automated email with the download link and instructions for accessing the bonuses.
If you are a Gold Pass member make sure you enter the special coupon code to get 20% discount off these prices.
Program 75 was developed for TradeStation 9.5 and above and is not compatible with MultiCharts.
Please note that any screen shots on this site are examples and are not meant to imply that any of these programs will generate profitable trades. THESE INDICATORS, SHOW ME STUDIES, STRATEGIES AND OTHER PROGRAMS HAVE BEEN INCLUDED SOLELY FOR EDUCATIONAL PURPOSES.
TO THE BEST OF MARKPLEX CORPORATION’S KNOWLEDGE, ALL OF THE INFORMATION ON THIS PAGE IS CORRECT, AND IT IS PROVIDED IN THE HOPE THAT IT WILL BE USEFUL. HOWEVER, MARKPLEX CORPORATION ASSUMES NO LIABILITY FOR ANY DAMAGES, DIRECT OR OTHERWISE, RESULTING FROM THE USE OF THIS INFORMATION AND/OR PROGRAM(S) DESCRIBED, AND NO WARRANTY IS MADE REGARDING ITS ACCURACY OR COMPLETENESS. USE OF THIS INFORMATION AND/OR PROGRAMS DESCRIBED IS AT YOUR OWN RISK.
ANY EASYLANGUAGE OR POWERLANGUAGE TRADING STRATEGIES, SIGNALS, STUDIES, INDICATORS, SHOWME STUDIES, PAINTBAR STUDIES, PROBABILITYMAP STUDIES, ACTIVITYBAR STUDIES, FUNCTIONS (AND PARTS THEREOF) AND ASSOCIATED TECHNIQUES REFERRED TO, INCLUDED IN OR ATTACHED TO THIS TUTORIAL OR PROGRAM DESCRIPTION ARE EXAMPLES ONLY, AND HAVE BEEN INCLUDED SOLELY FOR EDUCATIONAL PURPOSES. MARKPLEX CORPORATION. DOES NOT RECOMMEND THAT YOU USE ANY SUCH TRADING STRATEGIES, SIGNALS, STUDIES, INDICATORS, SHOWME STUDIES, PAINTBAR STUDIES, PROBABILITYMAP STUDIES, ACTIVITYBAR STUDIES, FUNCTIONS (OR ANY PARTS THEREOF) OR TECHNIQUES. THE USE OF ANY SUCH TRADING STRATEGIES, SIGNALS, STUDIES, INDICATORS, SHOWME STUDIES, PAINTBAR STUDIES, PROBABILITYMAP STUDIES, ACTIVITYBAR STUDIES, FUNCTIONS AND TECHNIQUES DOES NOT GUARANTEE THAT YOU WILL MAKE PROFITS, INCREASE PROFITS, OR MINIMIZE LOSSES.