
Transferring Fibonacci levels to another chart or charts
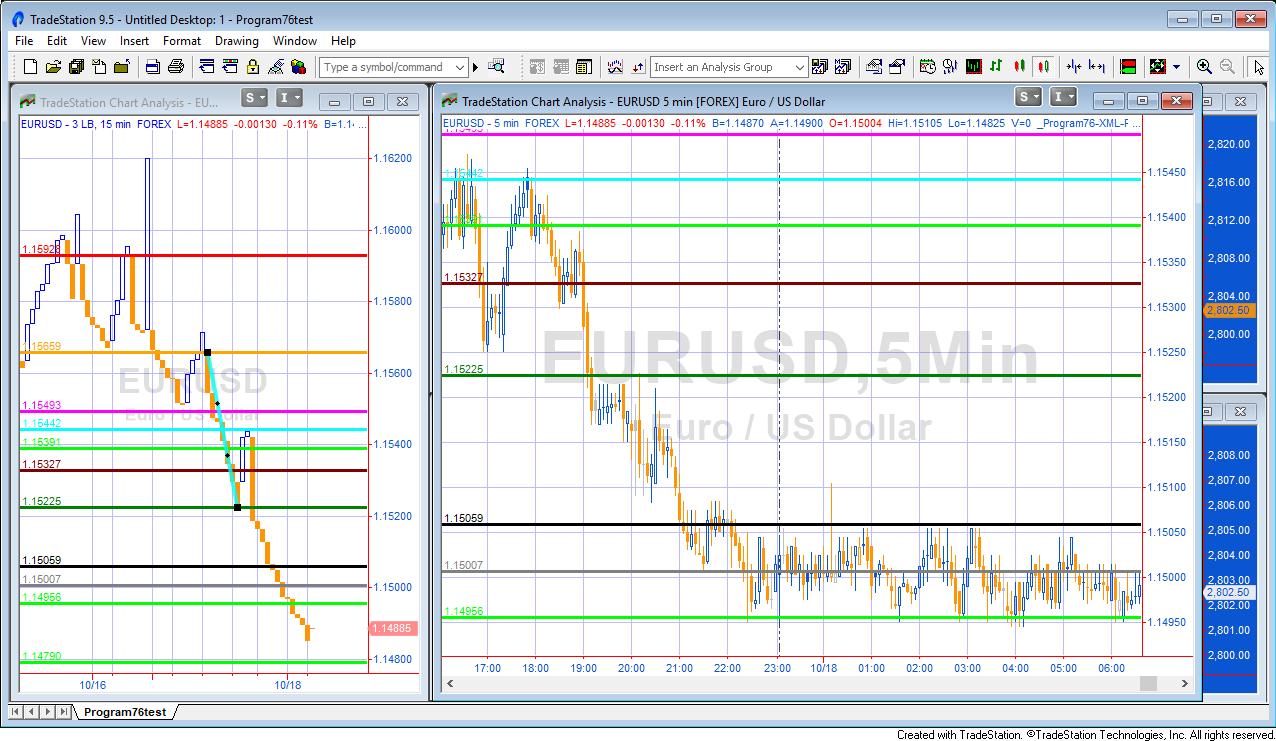
Program 76 consists of two show me studies. The ‘sender’ study (_Program76-XML-Sender) calculates Fibonacci and extension levels based on a manually drawn trend line (between two pivots, for example). These Fibonacci levels are stored in an XML file and saved to a hard drive. The ‘receiver’ study (_Program76-XML-Receiver) queries the XML file, retrieves the levels and draws them on the receiver chart or charts.
As well as being potentially useful, the program code uses a number of EasyLanguage development techniques that you may wish to use in your own projects.
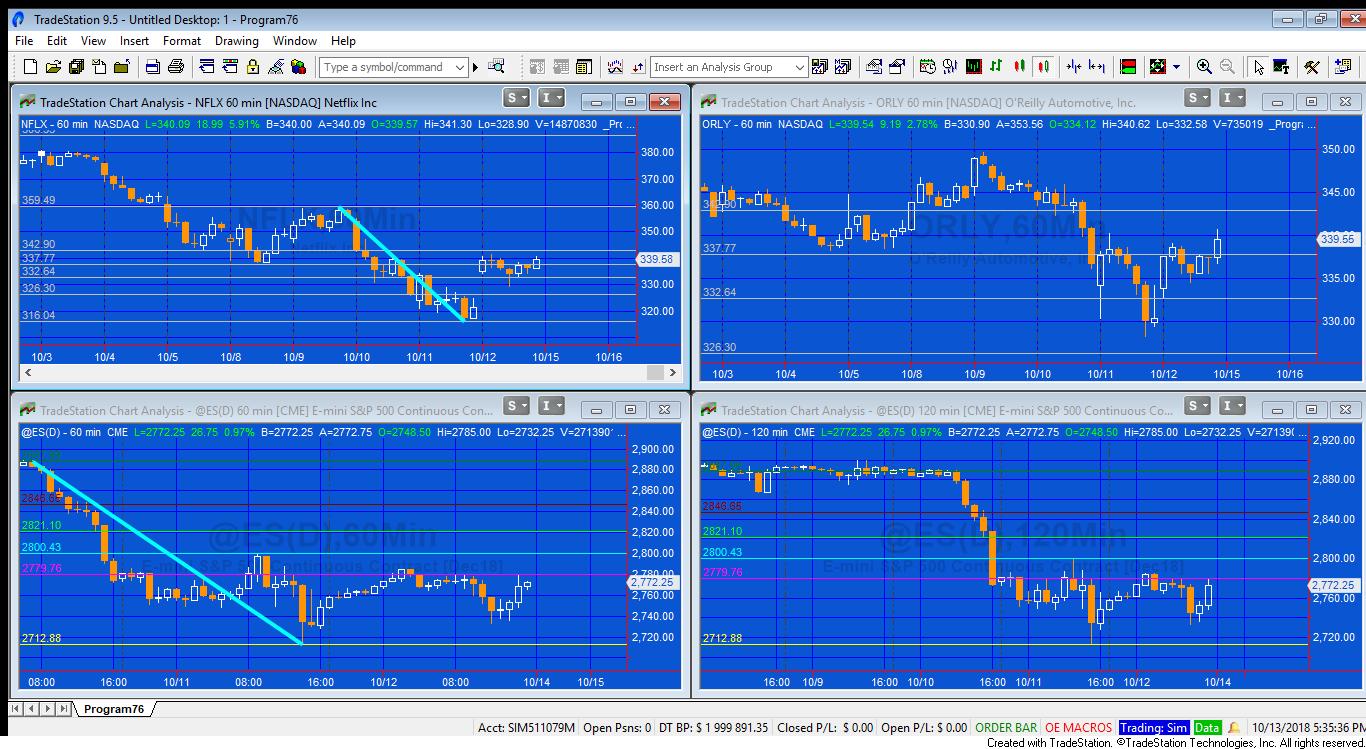
If a new trend line is drawn on the sending chart, the old trend line is deleted and the associated Fibonacci levels are recalculated. The horizontal lines are moved to the new levels and the levels are stored in the XML document. The receiving chart uses a timer to check the XML document every few seconds (a user input). If the levels in the XML document have changed since there last position was set, their price level is adjusted on the receiving chart.
The colors of the lines on the sending chart are determined by user inputs. These colors are stored in the XML file and thereby transferred to the receiving chart. If a color (or colors) are changed after the trend line is drawn, the XML file is updated and the next time the receiving chart checks the XML file, the color (or colors) will be changed.
 If there is already a trend line on the chart when the sending program is added, Fibonacci levels are calculated for this line and horizontal lines are drawn and stored in the XML file.
If a trend line is dragged into a new position the Fibonacci levels are recalculated, the horizontal lines are redrawn and the XML file is updated.
If the trend line is deleted the associated horizontal lines are also deleted and the Fibonacci levels stored in the XML document are set to zero.
Program 76 shares some similarities with Program 35 (XML edition) except that program 76:
- Calculates Fibonacci level based on a user drawn Trend line rather than spacing and giving control over horizontal lines themselves
- Color is specified in the inputs of the sending chart and relayed to the receiving chart, rather than being set as user inputs for both the sending and receiving programs
- Color is specified as a string rather than legacy color value (integer)
- Program76 uses a more complex XML structure. Whereas in program 35 the price value was stored in the level node, in program 76 to additional elements are used: FibVal and Color.
Video demonstration of program 76
Program setup
The sending program should be applied before the receiving program to ensure that there is an XML document created (if one did not already exist). If you wish to use several sending/receiving pairs of charts using the same XML document then the UniqueName should be set to a different string for each pair.
If you wish to send data to several receiving charts then simply make sure the the UniqueName and xmlFileName inputs are the same for all of the receiving charts.
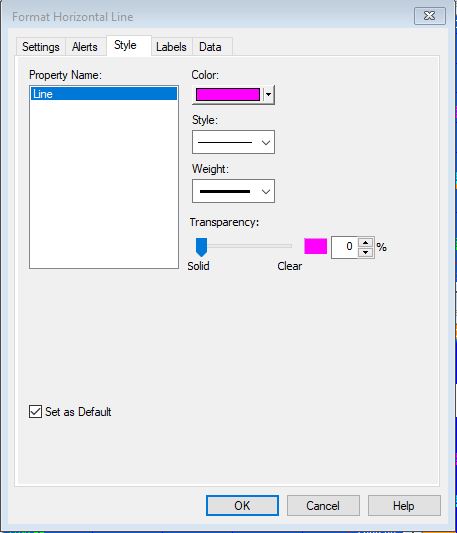
To change the weight of the horizontal lines, double click on one of the lines. When the following dialog appears click ‘NO.’
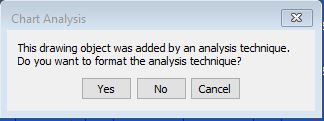 The following box will then appear. Adjust the weight of the line and click the set as default check box followed by OK. Then refresh the charts by clicking CTRL – R.
Inputs
_Program76-XML-Sender inputs
// Colors expressed as strings
string Color1( “Red” ), // Color of line 1
string Color2( “Yellow” ), // Color of line 2
string Color3( “Magenta” ), // Color of line 3
string Color4( “Cyan” ), // Color of line 4
string Color5( “Green” ), // Color of line 5
string Color6( “DarkRed” ), // Color of line 6
string Color7( “DarkGreen” ), // Color of line 7
string Color8( “Black” ), // Color of line 8
string Color9( “DarkGray” ), // Color of line 9
string Color10( “Green” ), // Color of line 10
string Color11( “Green” ), // Color of line 11
string UniqueName( “Fibs” ), // Unique name used for node in XML file. Make sure this is the same string as used in the receiving chart
string xmlFileName( “C:\XMLFib.xml” ); // Name and location of XML file
_Program76-XML-Receiver inputs
string UniqueName( “Fibs” ), // Unique name used for the node in the XML document. Make sure this is the same string as used in the sending chart
string xmlFileName( “C:\XMLFib.xml” ), // Name and location of XML file
int lineMoveInt( 2 ); // The program checks to see if changes have been made to the XML every this number of seconds
Program download
Program 76 was developed for TradeStation 9.5 and above and is not compatible with MultiCharts because of the objects used.
An UNPROTECTED version (i.e. the TradeStation EasyLanguage is fully functional and you can see the source code) and associated unprotected function is available for for IMMEDIATE download for $49- by clicking the ‘add to cart’ button. After download the program can be opened, you will be able to see the program code and modify it.
After purchase you will be redirected to a download page, so don’t close the browser. You will also receive an automated email with the download link and instructions for accessing the bonuses.
If you are a Gold Pass member make sure you enter the special coupon code to get 20% discount off these prices.
Program 76 was developed for TradeStation 9.5 and above and is not compatible with MultiCharts.
Color options
| AliceBlue | DarkSlateGray | LightSalmon | PaleVioletRed |
| AntiqueWhite | DarkTurquoise | LightSeaGreen | PapayaWhip |
| Aqua | DarkViolet | LightSkyBlue | PeachPuff |
| Aquamarine | DeepPink | LightSlateGray | Peru |
| Azure | DeepSkyBlue | LightSteelBlue | Pink |
| Beige | DimGray | LightYellow | Plum |
| Bisque | DodgerBlue | Lime | PowderBlue |
| Black | Firebrick | LimeGreen | Purple |
| BlanchedAlmond | FloralWhite | Linen | Red |
| Blue | ForestGreen | Magenta | RosyBrown |
| BlueViolet | Fuschia | Maroon | RoyalBlue |
| Brown | Gainsboro | MediumAquamarine | SaddleBrown |
| Burlywood | GhostWhite | MediumBlue | Salmon |
| CadetBlue | Gold | MediumOrchid | SandyBrown |
| Chartreuse | Goldenrod | MediumPurple | SeaGreen |
| Chocolate | Gray | MediumSeaGreen | Seashell |
| Coral | Green | MediumSlateBlue | Sienna |
| CornflowerBlue | GreenYellow | MediumSpringGreen | Silver |
| Cornsilk | Honeydew | MediumTurquoise | SkyBlue |
| Cyan | HotPink | MediumVioletRed | SlateBlue |
| DarkBlue | IndianRed | MidnightBlue | SlateGray |
| DarkBrown | Indigo | MintCream | Snow |
| DarkCyan | Ivory | MistyRose | SpringGreen |
| DarkGoldenrod | Khaki | Moccasin | SteelBlue |
| DarkGray | Lavender | NavajoWhite | Tan |
| DarkGreen | LavenderBlush | Navy | Teal |
| DarkKhaki | LawnGreen | OldLace | Thistle |
| Dark Magenta | LemonChiffon | Olive | Tomato |
| DarkOliveGreen | LightBlue | OliveDrab | Turquoise |
| DarkOrange | LightCoral | Orange | Violet |
| DarkOrchid | LightCyan | OrangeRed | Wheat |
| DarkRed | LightGoldenrodYellow | Orchid | White |
| DarkSalmon | LightGray | PaleGoldenrod | WhiteSmoke |
| DarkSeaGreen | LightGreen | PaleGreen | Yellow |
| DarkSlateBlue | LightPink | PaleTurquoise | YellowGreen |
Technical lessons
Program 76 uses the following programming techniques and syntax:
- Setting up, storing values and retrieving values from an XML file
- Using the Timer method
- Creating user defined methods
- Using the Try, Catch, Finally construct
- Storing lines, color, and trend lines in vectors
- Using the Chartinghost object to detect when a bar is clicked and to provide information on that bar
- Using a drawing object event to detect when a trend line is deleted
- Creating and moving drawing objects (Horizontal lines)
- Using strings to designate horizontal line colors
Program download
Program 76 was developed for TradeStation 9.5 and above and is not compatible with MultiCharts because of the objects used.
An UNPROTECTED version (i.e. the TradeStation EasyLanguage is fully functional and you can see the source code) and associated unprotected function is available for for IMMEDIATE download for $49- by clicking the ‘add to cart’ button. After download the program can be opened, you will be able to see the program code and modify it.
After purchase you will be redirected to a download page, so don’t close the browser. You will also receive an automated email with the download link and instructions for accessing the bonuses.
If you are a Gold Pass member make sure you enter the special coupon code to get 20% discount off these prices.
Program 76 was developed for TradeStation 9.5 and above and is not compatible with MultiCharts.
Please note that any screen shots on this site are examples and are not meant to imply that any of these programs will generate profitable trades. THESE INDICATORS, SHOW ME STUDIES, STRATEGIES AND OTHER PROGRAMS HAVE BEEN INCLUDED SOLELY FOR EDUCATIONAL PURPOSES.
TO THE BEST OF MARKPLEX CORPORATION’S KNOWLEDGE, ALL OF THE INFORMATION ON THIS PAGE IS CORRECT, AND IT IS PROVIDED IN THE HOPE THAT IT WILL BE USEFUL. HOWEVER, MARKPLEX CORPORATION ASSUMES NO LIABILITY FOR ANY DAMAGES, DIRECT OR OTHERWISE, RESULTING FROM THE USE OF THIS INFORMATION AND/OR PROGRAM(S) DESCRIBED, AND NO WARRANTY IS MADE REGARDING ITS ACCURACY OR COMPLETENESS. USE OF THIS INFORMATION AND/OR PROGRAMS DESCRIBED IS AT YOUR OWN RISK.
ANY EASYLANGUAGE OR POWERLANGUAGE TRADING STRATEGIES, SIGNALS, STUDIES, INDICATORS, SHOWME STUDIES, PAINTBAR STUDIES, PROBABILITYMAP STUDIES, ACTIVITYBAR STUDIES, FUNCTIONS (AND PARTS THEREOF) AND ASSOCIATED TECHNIQUES REFERRED TO, INCLUDED IN OR ATTACHED TO THIS TUTORIAL OR PROGRAM DESCRIPTION ARE EXAMPLES ONLY, AND HAVE BEEN INCLUDED SOLELY FOR EDUCATIONAL PURPOSES. MARKPLEX CORPORATION. DOES NOT RECOMMEND THAT YOU USE ANY SUCH TRADING STRATEGIES, SIGNALS, STUDIES, INDICATORS, SHOWME STUDIES, PAINTBAR STUDIES, PROBABILITYMAP STUDIES, ACTIVITYBAR STUDIES, FUNCTIONS (OR ANY PARTS THEREOF) OR TECHNIQUES. THE USE OF ANY SUCH TRADING STRATEGIES, SIGNALS, STUDIES, INDICATORS, SHOWME STUDIES, PAINTBAR STUDIES, PROBABILITYMAP STUDIES, ACTIVITYBAR STUDIES, FUNCTIONS AND TECHNIQUES DOES NOT GUARANTEE THAT YOU WILL MAKE PROFITS, INCREASE PROFITS, OR MINIMIZE LOSSES.