
Bar run and chart that shows a profile of the bar

A Gold Pass member asked me how he could go about creating a program that showed when a ‘bar-run’ occurred. He defined a bar-run as being an unusually long down bar that closed near its low or an unusually long bar that closed near its high.
In this program to qualify as a down ‘bar-run’ bar, a bar must be a down bar, have a range bigger than a user input amount (MinDiff), close with a user input percentage (Perc) of the low of the bar, and its range must be greater or equal to the largest of the previous user input number of bars (NumBars) multiplied by a user input percentage (Perc2) (see the user inputs below).
For a bar to qualify as a up ‘bar-run’ bar it must be an up bar, have a range bigger than a user input amount (MinDiff), close with a user input percentage (Perc) of the high of the bar, and its range must be greater or equal to the largest of the previous user input number of bars (NumBars) multiplied by a user input percentage (Perc2) (see the user inputs below).
It is easy to create a program to do this (I have included a free example of such a program in the Gold Pass section below), but it made me think that the price moves following a bar-run might also be dependent on the ‘shape’ or profile of the price move within the bar-run bar.
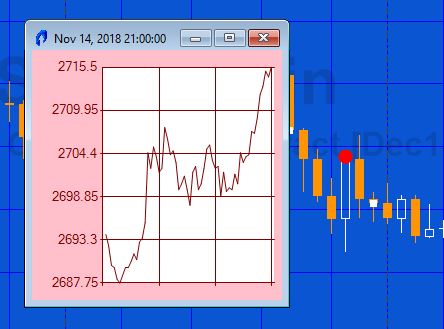
Program 77 (_Program77_BarRun) displays a bar price profile to the minute level (i.e. for a 30 minute bar you will see 30 data points).
When it is first applied to a chart the profile of the last bar is displayed. The color of the profile chart is dependent on whether it is a bar-run chart up, a bar-run chart down, or not a bar-run chart. The date and time of the bar are displayed at the top of the form.
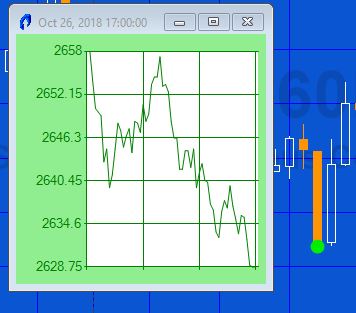
When subsequent bars are clicked their profiles are plotted and the color of the profile chart is set to green for a down ‘bar run’ bar, red for an up ‘bar run’ bar, and blue for a bar that is neither a bar run up or down bar. The date and time of the bar clicked are displayed at the top of the form.
Inputs
Double Perc( 20), // Determines how close to the low or high the close needs to be
Int NumBars( 5), // The range needs to be the biggest in this number of bars
double MinDiff( 20), // Min range of bar
double Perc2( 20), // A percentage of how much bigger (in percentage terms) that the last NumBars a BarRun bar needs to be
// Color options
// Colors for the chart the shows the bar profile
string DnBar1( “DarkGreen” ), // Used for bar run down bar
string DnBar2( “LightGreen” ), // Used for bar run down bar
string UpBar1( “DarkRed” ), // Used for bar run up bar
string UpBar2( “Pink”), // Used for bar run up bar
string DefBar1( “DarkBlue” ), // Used for bar that is neither a bar run up or bar run down bar
string DefBar2( “PowderBlue” ); // Used for bar that is neither a bar run up or bar run down bar
Program 77 video explanation
Program 77 download
Both the _Program77_BarRun show me study is available for immediate download for $39.95. It works with TradeStation but not MultiCharts. Click the ‘add to cart’ button below. You may pay using PayPal or a credit card.
Programming notes
- Using methods
- Using a price series provider to provide intrabar data
- Creating a form containing a chart
- Adding data points to the chart
- Creating a chart element click event when a bar is clicked
- Finding strategies to deal with the problem of the program recalculating when MaxBarsBack is set to autodetect (see below)
- Using color objects in plot statements
MaxBarsBack detection issues
- Auto-detect
- User defined
These can be found by clicking Format – Analysis Techniques, select _Program77_BarRun and click the Format button. Select the General tab.
If Auto-detect is selected, the MaxBarsBack is initially set to 1. When a bar is clicked the program automatically recalculates the MaxBarsBack. You will then need to click the bar again for it to analyze the bar.
Another approach which I think works better to to set the MaxBarsBack setting to User defined. I suggest a value of 2000. Then set the number of bars to load for the symbol to double this number, i.e. 4000. You will then be able to click bars without the program refreshing itself.
I have also added a rectangle to the program. With User defined selected the rectangle indicates which bars clicked will trigger a ‘not enough bars loaded’ error. With Auto-detect selected the rectangle indicates that if a bar is clicked in it, the program will recalculate. This occurs up to the point where the user clicks a bar that is greater than half the number of bars on the chart.
Gold Pass content
Please note that any screen shots on this site are examples and are not meant to imply that any of these programs will generate profitable trades. THESE INDICATORS, SHOW ME STUDIES, STRATEGIES AND OTHER PROGRAMS HAVE BEEN INCLUDED SOLELY FOR EDUCATIONAL PURPOSES.
TO THE BEST OF MARKPLEX CORPORATION’S KNOWLEDGE, ALL OF THE INFORMATION ON THIS PAGE IS CORRECT, AND IT IS PROVIDED IN THE HOPE THAT IT WILL BE USEFUL. HOWEVER, MARKPLEX CORPORATION ASSUMES NO LIABILITY FOR ANY DAMAGES, DIRECT OR OTHERWISE, RESULTING FROM THE USE OF THIS INFORMATION AND/OR PROGRAM(S) DESCRIBED, AND NO WARRANTY IS MADE REGARDING ITS ACCURACY OR COMPLETENESS. USE OF THIS INFORMATION AND/OR PROGRAMS DESCRIBED IS AT YOUR OWN RISK.
ANY EASYLANGUAGE OR POWERLANGUAGE TRADING STRATEGIES, SIGNALS, STUDIES, INDICATORS, SHOWME STUDIES, PAINTBAR STUDIES, PROBABILITYMAP STUDIES, ACTIVITYBAR STUDIES, FUNCTIONS (AND PARTS THEREOF) AND ASSOCIATED TECHNIQUES REFERRED TO, INCLUDED IN OR ATTACHED TO THIS TUTORIAL OR PROGRAM DESCRIPTION ARE EXAMPLES ONLY, AND HAVE BEEN INCLUDED SOLELY FOR EDUCATIONAL PURPOSES. MARKPLEX CORPORATION. DOES NOT RECOMMEND THAT YOU USE ANY SUCH TRADING STRATEGIES, SIGNALS, STUDIES, INDICATORS, SHOWME STUDIES, PAINTBAR STUDIES, PROBABILITYMAP STUDIES, ACTIVITYBAR STUDIES, FUNCTIONS (OR ANY PARTS THEREOF) OR TECHNIQUES. THE USE OF ANY SUCH TRADING STRATEGIES, SIGNALS, STUDIES, INDICATORS, SHOWME STUDIES, PAINTBAR STUDIES, PROBABILITYMAP STUDIES, ACTIVITYBAR STUDIES, FUNCTIONS AND TECHNIQUES DOES NOT GUARANTEE THAT YOU WILL MAKE PROFITS, INCREASE PROFITS, OR MINIMIZE LOSSES.