
Analysis of volume at chart price levels
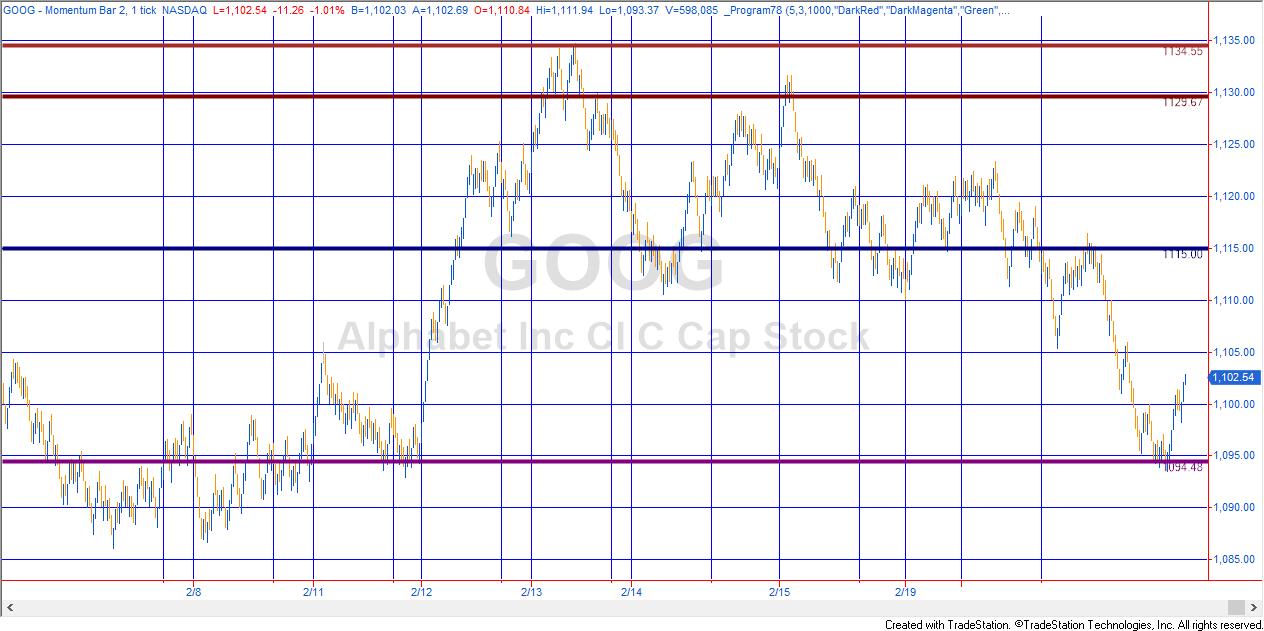
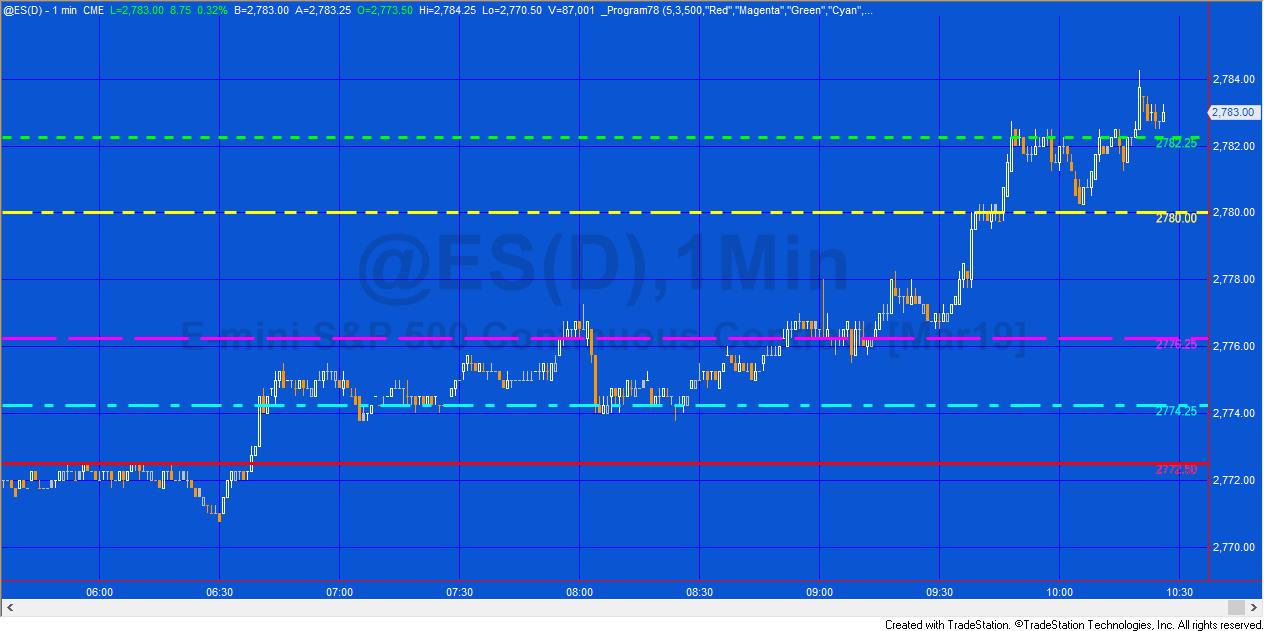
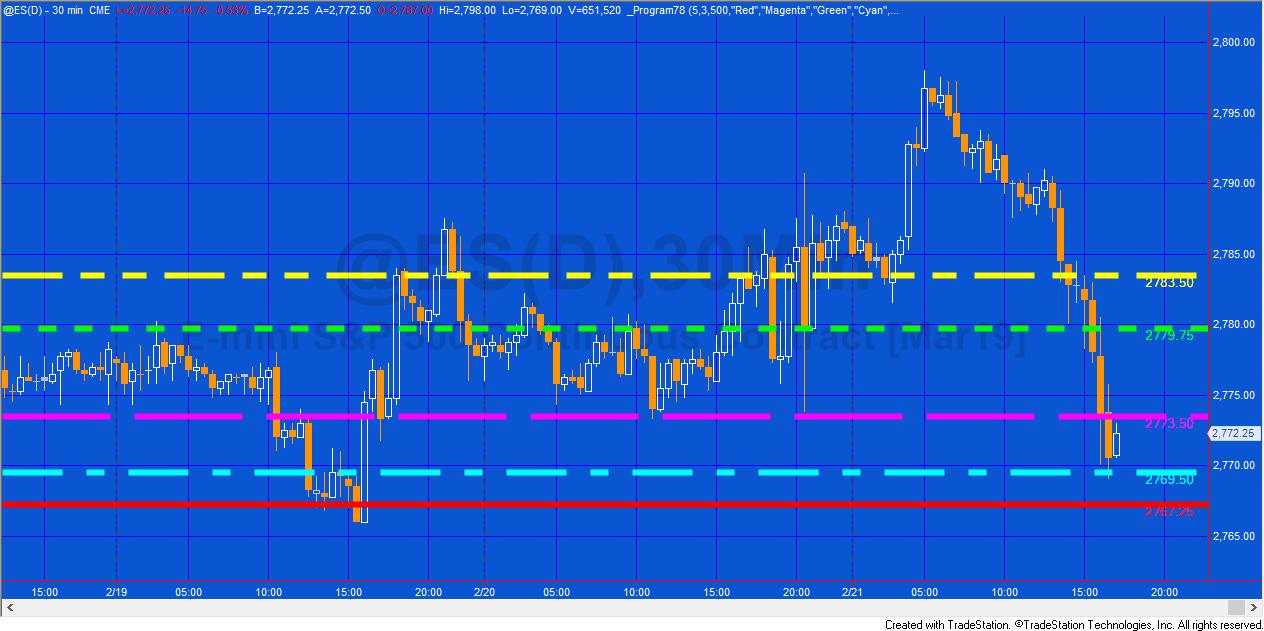
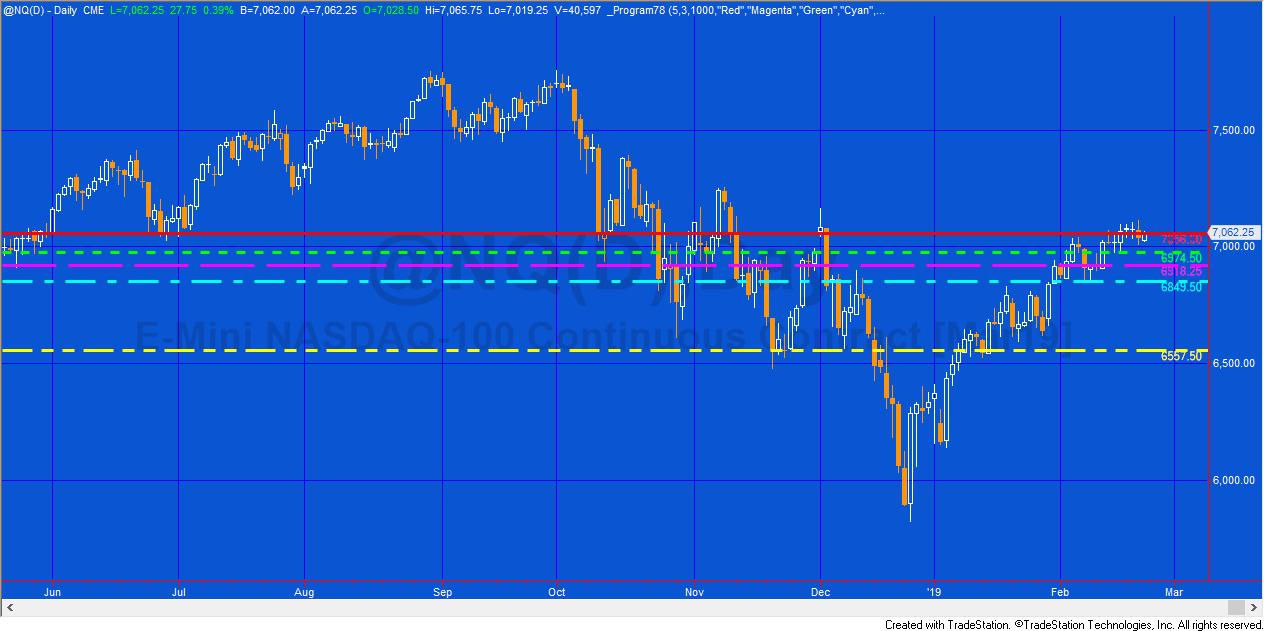
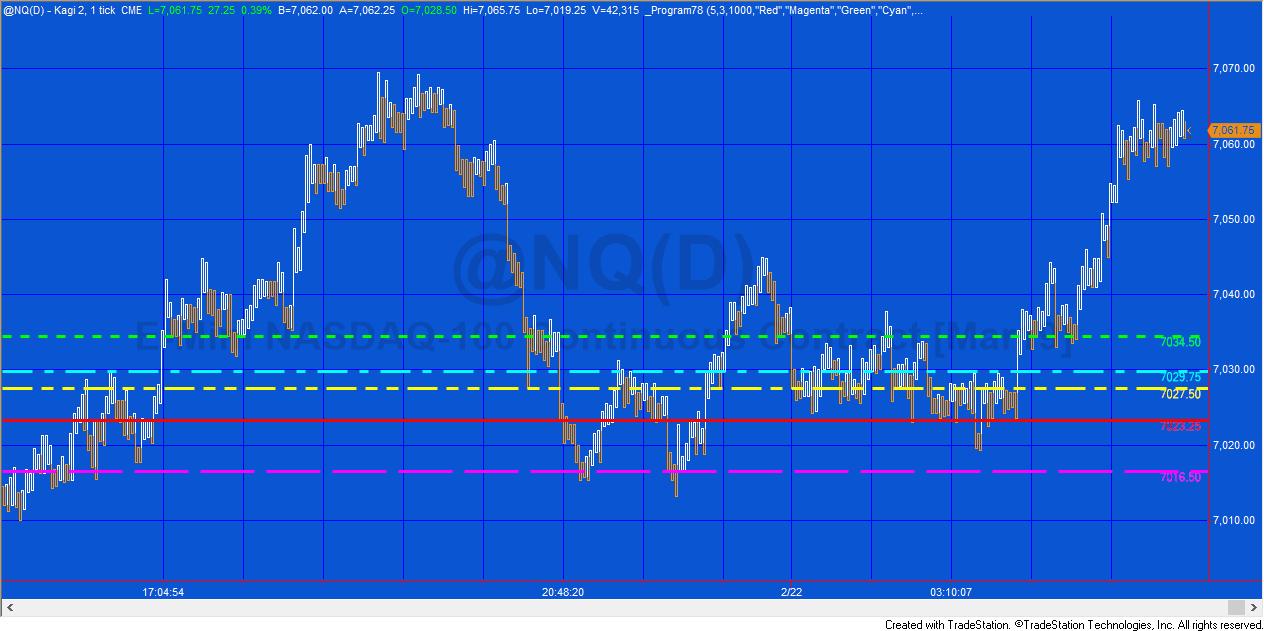
 Program 78 estimates horizontal support and resistance lines based on the chart’s volume profile. The theory underlying program 78 is that if significant volume has occurred at a specific price level then that level may have some significance as an area of support and/or resistance. Unlike program 56 which analyzes all the bars on a chart (after maxbarsback bars), program 78 only analyzes a user defined number of bars starting from the last completed bar on the chart and counting backwards.

Program 78 is available for immediate download for $124.95. The download is a TradeStation ELD file that includes the unprotected and commented program. This program will not work in MultiCharts because it uses the TradeStation collections and other functionality that is not available in the MultiCharts environment.
- Program56 analyzes every bar on the chart, whereas Program78 analyses a user input number of bars.
- Program78 does not prioritize levels that can be seen on the current chart window. Rather, if levels are outside of the range of the chart, they are not shown.
- Program 78 prints levels information in the Print log.
The program 78 volume profile calculation
The volume profile is stored in a dictionary. The closing price (converted to a string) is used as the index and the sum of volume for bars closing at that price is stored as the value.
When the program is first applied to the chart it populates the volume profile dictionary by examining each bar. If there is not an index in the dictionary for a specific closing price, the closing price (converted to a string) and the volume are added to the dictionary. If the closing price is found in the dictionary, the volume of the newly found bar is added to the volume for this price.
At the close of each new bar the program stores the volume associated with that bar in a dictionary (PriceVolume) with a key of the closing price of the bar. If a key-value pair already exists in the dictionary for the price, the volume is added to the existing volume for that price.
Because we are only interested in the user input number of bars, after each new bar is formed the volume for the oldest bar stored in the dictionary is subtracted from the dictionary . If the volume for that price index is now zero, the price/volume pair is deleted from the dictionary.
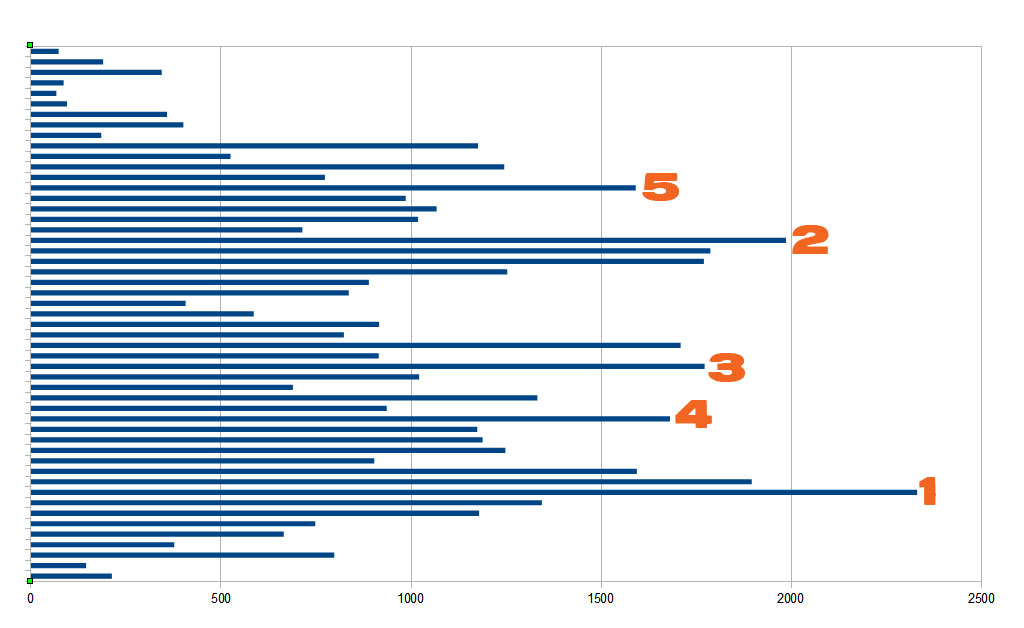
Finding volume ‘pivots’
Once the volume profile dictionary is populated or updated, program 78 looks for volume ‘pivots’. Referring to the image below, to qualify as a pivot there must be a user specified number of smaller bars above the pivot and below the pivot.
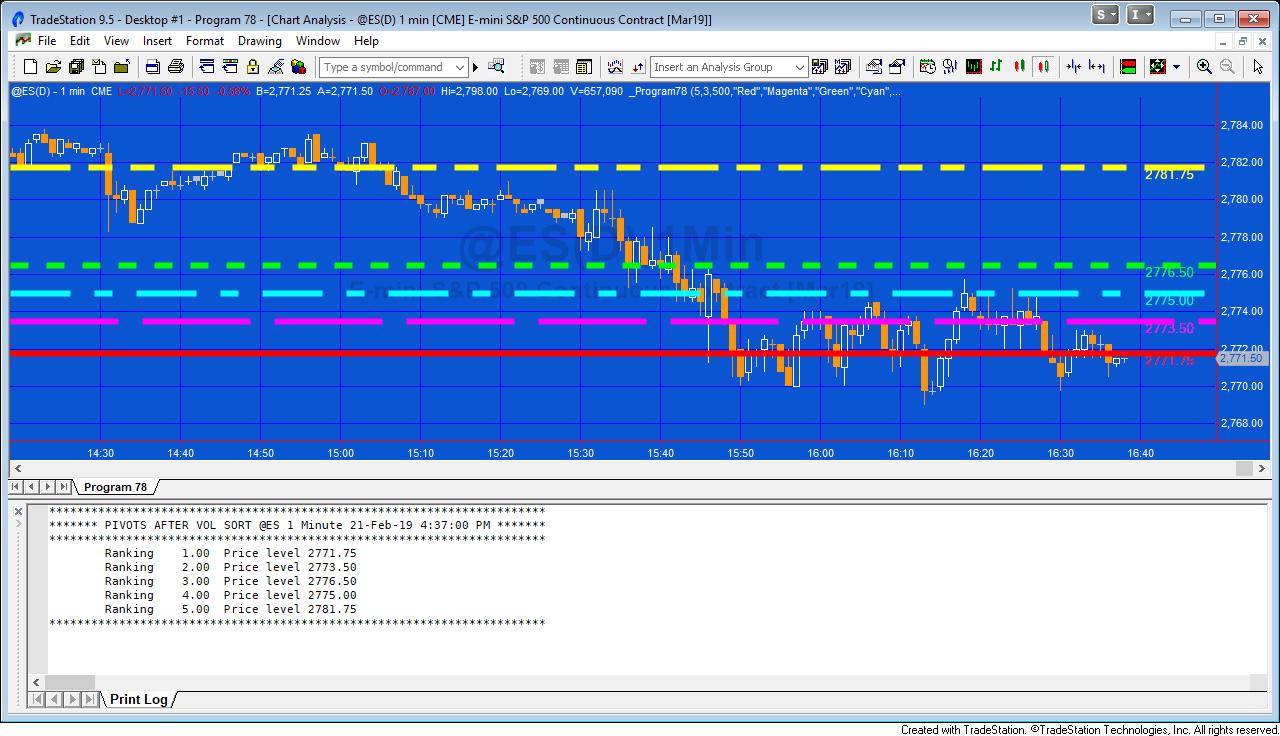
Once found these ‘pivots’ are stored in another dictionary (PriceVolumePivots). A vector of the keys for this new dictionary are then sorted by their volume values and the resulting price levels are drawn on the chart. The volume pivot with the highest volume is drawn using user inputs: Color1 and LineStyle1, the next highest is drawn using Color2 and LineStyle2 etc.
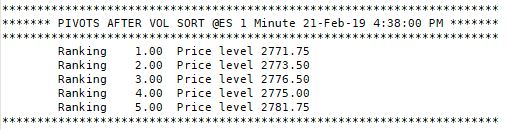 In addition to drawing horizontal lines and labels on the chart to highlight the levels, the program also prints the information in the print log. This can be useful if a large number of bars were being analyzed and some of the horizontal lines were outside of the range of the chart.
Video
[titled_box title=”User exceptions” variation=”orange”]Program 78 includes 3 user exceptions
- If the TopVolPivots input is greater than 20
- If the LineThickness input is less than 0 or greater than 6
- If the number of bars loaded for the symbol is less than the GoBackBars user input.[/titled_box]
Inputs
TopVolPivots
The total number of horizontal lines to be drawn, with the highest occurrence values. TopVolPivots must be a positive integer up to 20. This number determines the number of horizontal lines drawn on a chart. Clearly a large number might make the screen confusing whereas a smaller number might result in the user missing some important levels.
If a number outside the 0 – 20 range is entered, a user runtime error will be generated.
Strength
Left and right strength of volume pivots
GoBackBars
The number of bars to store in the volume vector
Line colors
The following inputs determine the color of the horizontal lines draw. Color1 would be for the level that has occurred the most frequently, color2 the level that occurred next most frequently etc. If there are the same number of occurrences at two or more levels, the most recent gets the ‘highest’ color. For example, if there were 40 occurrences at a price of $1.00 and 40 at $1.20 and 40 was the highest number of occurrences, then the pivot that occurred most recently at each level would determine which level was colored Color1 and which was colored Color2.
If TopVolPivots is greater than 10 the colors are ‘recycled’ at a slightly darker shade, so that Color11 would be a darker shade of Color1, Color12 would be a darker shade of Color2 etc
string Color1( “Red” ),
string Color2( “Magenta” ),
string Color3( “Green” ),
string Color4( “Cyan” ),
string Color5( “Yellow” ),
string Color6( “White” ),
string Color7( “White” ),
string Color8( “LightGray” ),
string Color9( “LightGray” ),
string Color10( “LightGray” ),
N.B. The program uses the color objects, hence the colors are expressed as strings
Line styles
Line styles are applied to the lines in the same way as the color styling, i.e. for the level with the highest number of occurrences would be styled using LineStyle1. The level with the next highest number of occurrences would be styled by using LineStyle2 etc.
The available styles are:
- Solid 0
- Dashed 1
- Dotted 2
- Dashed2 3
- Dashed3 4
LineStyle1( 0 )
LineStyle2( 0 )
LineStyle3( 0 )
LineStyle4( 0 )
LineStyle5( 0 )
LineStyle6( 0 )
LineStyle7( 0 )
LineStyle8( 0 )
LineStyle9( 0 )
LineStyle10( 0 )
FontName( “Ariel” )
Font name determines the font of the text that displays the price value of each line to the right of the chart.
FontSize( 10 )
Font size determines that size of the text that displays the price value of each line to the right of the chart.
LineThickness( 1 )
Defines thickness of lines. LineThickness can be an integer between 0 and 6. If a number outside this range is entered a runtime error will be generated.
DrawLabels( True)
If set to true labels are added to the right of the horizontal lines.
Print_Dialog( True )
If set to TRUE line information is printed in the print dialog
Technical architecture
Program 78 uses vectors and dictionaries extensively. It may be useful if you are looking for examples of:
- Populating dictionaries
- Locating a dictionary entry and updating its value
- Deleting dictionary entries
- Extracting vectors of values and keys from a dictionary
- Sorting a vector
- Drawing and updating trendlines and their associated labels
- Finding ‘volume pivots’ in a dictionary
- Generating user exceptions
In the following gallery, click the thumbnail to see a larger version of the image.

THESE INDICATORS, SHOW ME STUDIES, STRATEGIES AND OTHER PROGRAMS HAVE BEEN INCLUDED SOLELY FOR EDUCATIONAL PURPOSES.
TO THE BEST OF MARKPLEX CORPORATION’S KNOWLEDGE, ALL OF THE INFORMATION ON THIS PAGE IS CORRECT, AND IT IS PROVIDED IN THE HOPE THAT IT WILL BE USEFUL. HOWEVER, MARKPLEX CORPORATION ASSUMES NO LIABILITY FOR ANY DAMAGES, DIRECT OR OTHERWISE, RESULTING FROM THE USE OF THIS INFORMATION AND/OR PROGRAM(S) DESCRIBED, AND NO WARRANTY IS MADE REGARDING ITS ACCURACY OR COMPLETENESS. USE OF THIS INFORMATION AND/OR PROGRAMS DESCRIBED IS AT YOUR OWN RISK.
ANY EASYLANGUAGE OR POWERLANGUAGE TRADING STRATEGIES, SIGNALS, STUDIES, INDICATORS, SHOWME STUDIES, PAINTBAR STUDIES, PROBABILITYMAP STUDIES, ACTIVITYBAR STUDIES, FUNCTIONS (AND PARTS THEREOF) AND ASSOCIATED TECHNIQUES REFERRED TO, INCLUDED IN OR ATTACHED TO THIS TUTORIAL OR PROGRAM DESCRIPTION ARE EXAMPLES ONLY, AND HAVE BEEN INCLUDED SOLELY FOR EDUCATIONAL PURPOSES. MARKPLEX CORPORATION. DOES NOT RECOMMEND THAT YOU USE ANY SUCH TRADING STRATEGIES, SIGNALS, STUDIES, INDICATORS, SHOWME STUDIES, PAINTBAR STUDIES, PROBABILITYMAP STUDIES, ACTIVITYBAR STUDIES, FUNCTIONS (OR ANY PARTS THEREOF) OR TECHNIQUES. THE USE OF ANY SUCH TRADING STRATEGIES, SIGNALS, STUDIES, INDICATORS, SHOWME STUDIES, PAINTBAR STUDIES, PROBABILITYMAP STUDIES, ACTIVITYBAR STUDIES, FUNCTIONS AND TECHNIQUES DOES NOT GUARANTEE THAT YOU WILL MAKE PROFITS, INCREASE PROFITS, OR MINIMIZE LOSSES.