
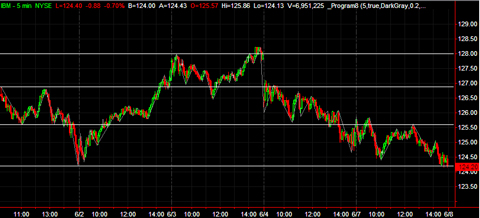
The idea behind this showme study is that turning points in price action might occur at or near to support or resistance levels. If turning points occur more than once near a specific level then it may be that this level has some significance, in other words, if a level appeared to provide support or resistance previously, then it may do so again.
Back in tutorial 13 I created a program that used pivot based pivots (i.e. support and resistance lines based on historical pivots). The program worked fine but required users to fine tune inputs.
This new program was created with the following objectives:
1. Make it easier for users to get meaningful results without having to manipulate too many inputs.
2. Reduce the computer’s processing load.
See a video demonstration below.
How it works
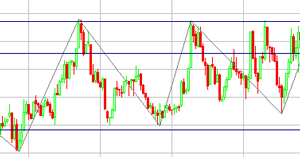
This program finds turning points in price action using the zig zag method. Once a new turning point is found, its price level is compared with price levels already stored in an array (if any). If the new level is within a user-specified tolerance of an existing line then the two lines are ‘combined’ by increasing the ‘significance index’ and updating the date and time associated with the level.
 If a new line is found that is not within a user specified tolerance of an existing line, it is stored in the array with a significance index of one and given the date and time when it occurred. If the array is full, the oldest entry is deleted before adding the new entry.
On the last bar of the chart the array is sorted by the significance index and date/time and the top entries (the number is a user specified input) are plotted on the chart in the currently viewable window. The levels will then stay the same unless the chart is refreshed (for example, by pressing CTR-R), hence minimizing processing resource.
This unprotected and commented program (i.e. the TradeStation EasyLanguage indicator) and associated array sort function is available for immediate download for $69.95 by clicking the following button. Payment may be made by credit card or PayPal.
The program was developed in TradeStation 8.7 (and so is compatible with versions 8.7 and above, including 9.1) and works on intraday, daily, weekly, and monthly charts.
See the video below for more information.
User inputs
NumberLinesToShow( 10 ), // Number of combined lines to show
RetracePerc( 0.2 ), // Percentage above running pivot that pivot must be formed to start a new zig zag
CombineVal( 50 * MinMove / PriceScale ), // Numeric value above or below Fibonacci line for existing line to be combined
ShowZigZag( TRUE ), // Set to TRUE to see the zig zag lines
ZigZagCol( DarkGray ), // Color of zig zag line
CombineCol( DarkBlue ); // Color of combined lines
Notes:
The NumberLinesToShow determines how many horizontal levels you wish to draw. The program will plot this number of lines (provided there are at least this number of levels stored in the array) based on up to 500 levels found on the chart, sorted first by significance and secondly by date. The ‘most significant’ lines are drawn. If several lines have equal significance they are sorted by date/time with those with the most recent date/time appearing first.
RetracePerc determines how the zig zags are drawn. Its value should be adjusted according to user preference to show turning points with the required level of significance.
CombineVal( 50 * MinMove / PriceScale ) is used to determine how close to an existing line, a new line must be to create a new “combined line” with an increase in its significance index.
Other things that will determine where the levels are located will include how much data you have loaded on the chart and the area of the chart you can see in the current window.
The program only shows levels for the window ending at the present date and time. I demonstrate this in the video.
TO THE BEST OF MARKPLEX CORPORATION’S KNOWLEDGE, ALL OF THE INFORMATION ON THIS PAGE IS CORRECT, AND IT IS PROVIDED IN THE HOPE THAT IT WILL BE USEFUL. HOWEVER, MARKPLEX CORPORATION ASSUMES NO LIABILITY FOR ANY DAMAGES, DIRECT OR OTHERWISE, RESULTING FROM THE USE OF THIS INFORMATION AND/OR PROGRAM(S) DESCRIBED, AND NO WARRANTY IS MADE REGARDING ITS ACCURACY OR COMPLETENESS. USE OF THIS INFORMATION AND/OR PROGRAMS DESCRIBED IS AT YOUR OWN RISK.
ANY EASYLANGUAGE OR POWERLANGUAGE TRADING STRATEGIES, SIGNALS, STUDIES, INDICATORS, SHOWME STUDIES, PAINTBAR STUDIES, PROBABILITYMAP STUDIES, ACTIVITYBAR STUDIES, FUNCTIONS (AND PARTS THEREOF) AND ASSOCIATED TECHNIQUES REFERRED TO, INCLUDED IN OR ATTACHED TO THIS TUTORIAL OR PROGRAM DESCRIPTION ARE EXAMPLES ONLY, AND HAVE BEEN INCLUDED SOLELY FOR EDUCATIONAL PURPOSES. MARKPLEX CORPORATION. DOES NOT RECOMMEND THAT YOU USE ANY SUCH TRADING STRATEGIES, SIGNALS, STUDIES, INDICATORS, SHOWME STUDIES, PAINTBAR STUDIES, PROBABILITYMAP STUDIES, ACTIVITYBAR STUDIES, FUNCTIONS (OR ANY PARTS THEREOF) OR TECHNIQUES. THE USE OF ANY SUCH TRADING STRATEGIES, SIGNALS, STUDIES, INDICATORS, SHOWME STUDIES, PAINTBAR STUDIES, PROBABILITYMAP STUDIES, ACTIVITYBAR STUDIES, FUNCTIONS AND TECHNIQUES DOES NOT GUARANTEE THAT YOU WILL MAKE PROFITS, INCREASE PROFITS, OR MINIMIZE LOSSES.
This unprotected and commented program (i.e. the TradeStation EasyLanguage indicator) and associated array sort function is available for immediate download for $69.95 by clicking the following button. Payment may be made by credit card or PayPal.
The program was developed in TradeStation 8.7 (and so is compatible with versions 8.7 and above, including 9.1) and works on intraday, daily, weekly, and monthly charts.
Video demonstration of Program 8
This unprotected and commented program (i.e. the TradeStation EasyLanguage indicator) and associated array sort function is available for immediate download for $69.95 by clicking the following button. Payment may be made by credit card or PayPal.
The program was developed in TradeStation 8.7 (and so is compatible with versions 8.7 and above, including 9.1) and works on intraday, daily, weekly, and monthly charts.
If you would prefer to pay be check, please make a check payable to Billy Fire LLC and mail to Billy Fire LLC, 14781 Pomerado Road, #110, Poway CA 92064 together with a valid email address. I will email download instructions to you.
The program is ‘unprotected,’ in other words, you will be able to see and edit the program.
Please email any bugs that you may discover to support@markplex.com.
TO THE BEST OF MARKPLEX CORPORATION’S KNOWLEDGE, ALL OF THE INFORMATION ON THIS PAGE IS CORRECT, AND IT IS PROVIDED IN THE HOPE THAT IT WILL BE USEFUL. HOWEVER, MARKPLEX CORPORATION ASSUMES NO LIABILITY FOR ANY DAMAGES, DIRECT OR OTHERWISE, RESULTING FROM THE USE OF THIS INFORMATION AND/OR PROGRAM(S) DESCRIBED, AND NO WARRANTY IS MADE REGARDING ITS ACCURACY OR COMPLETENESS. USE OF THIS INFORMATION AND/OR PROGRAMS DESCRIBED IS AT YOUR OWN RISK.
ANY EASYLANGUAGE OR POWERLANGUAGE TRADING STRATEGIES, SIGNALS, STUDIES, INDICATORS, SHOWME STUDIES, PAINTBAR STUDIES, PROBABILITYMAP STUDIES, ACTIVITYBAR STUDIES, FUNCTIONS (AND PARTS THEREOF) AND ASSOCIATED TECHNIQUES REFERRED TO, INCLUDED IN OR ATTACHED TO THIS TUTORIAL OR PROGRAM DESCRIPTION ARE EXAMPLES ONLY, AND HAVE BEEN INCLUDED SOLELY FOR EDUCATIONAL PURPOSES. MARKPLEX CORPORATION. DOES NOT RECOMMEND THAT YOU USE ANY SUCH TRADING STRATEGIES, SIGNALS, STUDIES, INDICATORS, SHOWME STUDIES, PAINTBAR STUDIES, PROBABILITYMAP STUDIES, ACTIVITYBAR STUDIES, FUNCTIONS (OR ANY PARTS THEREOF) OR TECHNIQUES. THE USE OF ANY SUCH TRADING STRATEGIES, SIGNALS, STUDIES, INDICATORS, SHOWME STUDIES, PAINTBAR STUDIES, PROBABILITYMAP STUDIES, ACTIVITYBAR STUDIES, FUNCTIONS AND TECHNIQUES DOES NOT GUARANTEE THAT YOU WILL MAKE PROFITS, INCREASE PROFITS, OR MINIMIZE LOSSES.