In technical trading, relative volume is a metric that compares the current trading volume of an asset (such as a stock, cryptocurrency, or other security) to its average trading volume over a specified period. It helps traders assess the strength or weakness of a price move by evaluating whether the volume supporting that move is unusually high or low.
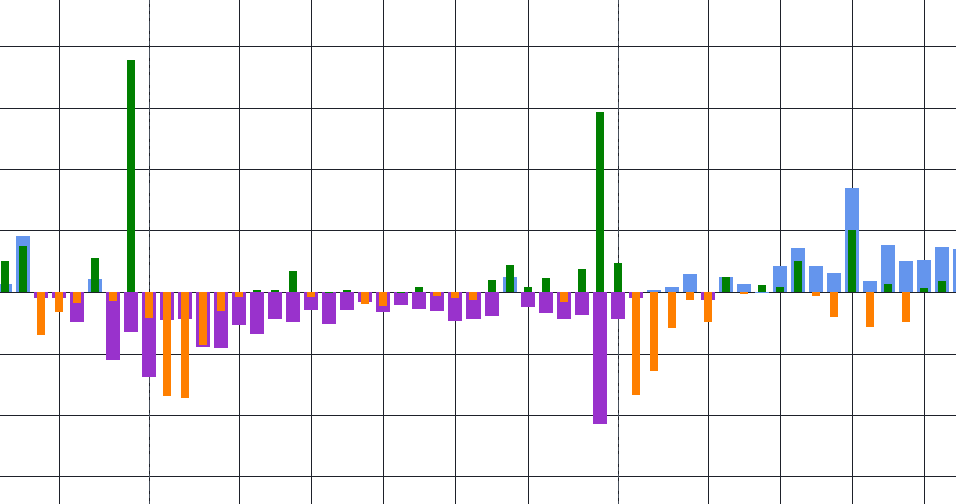
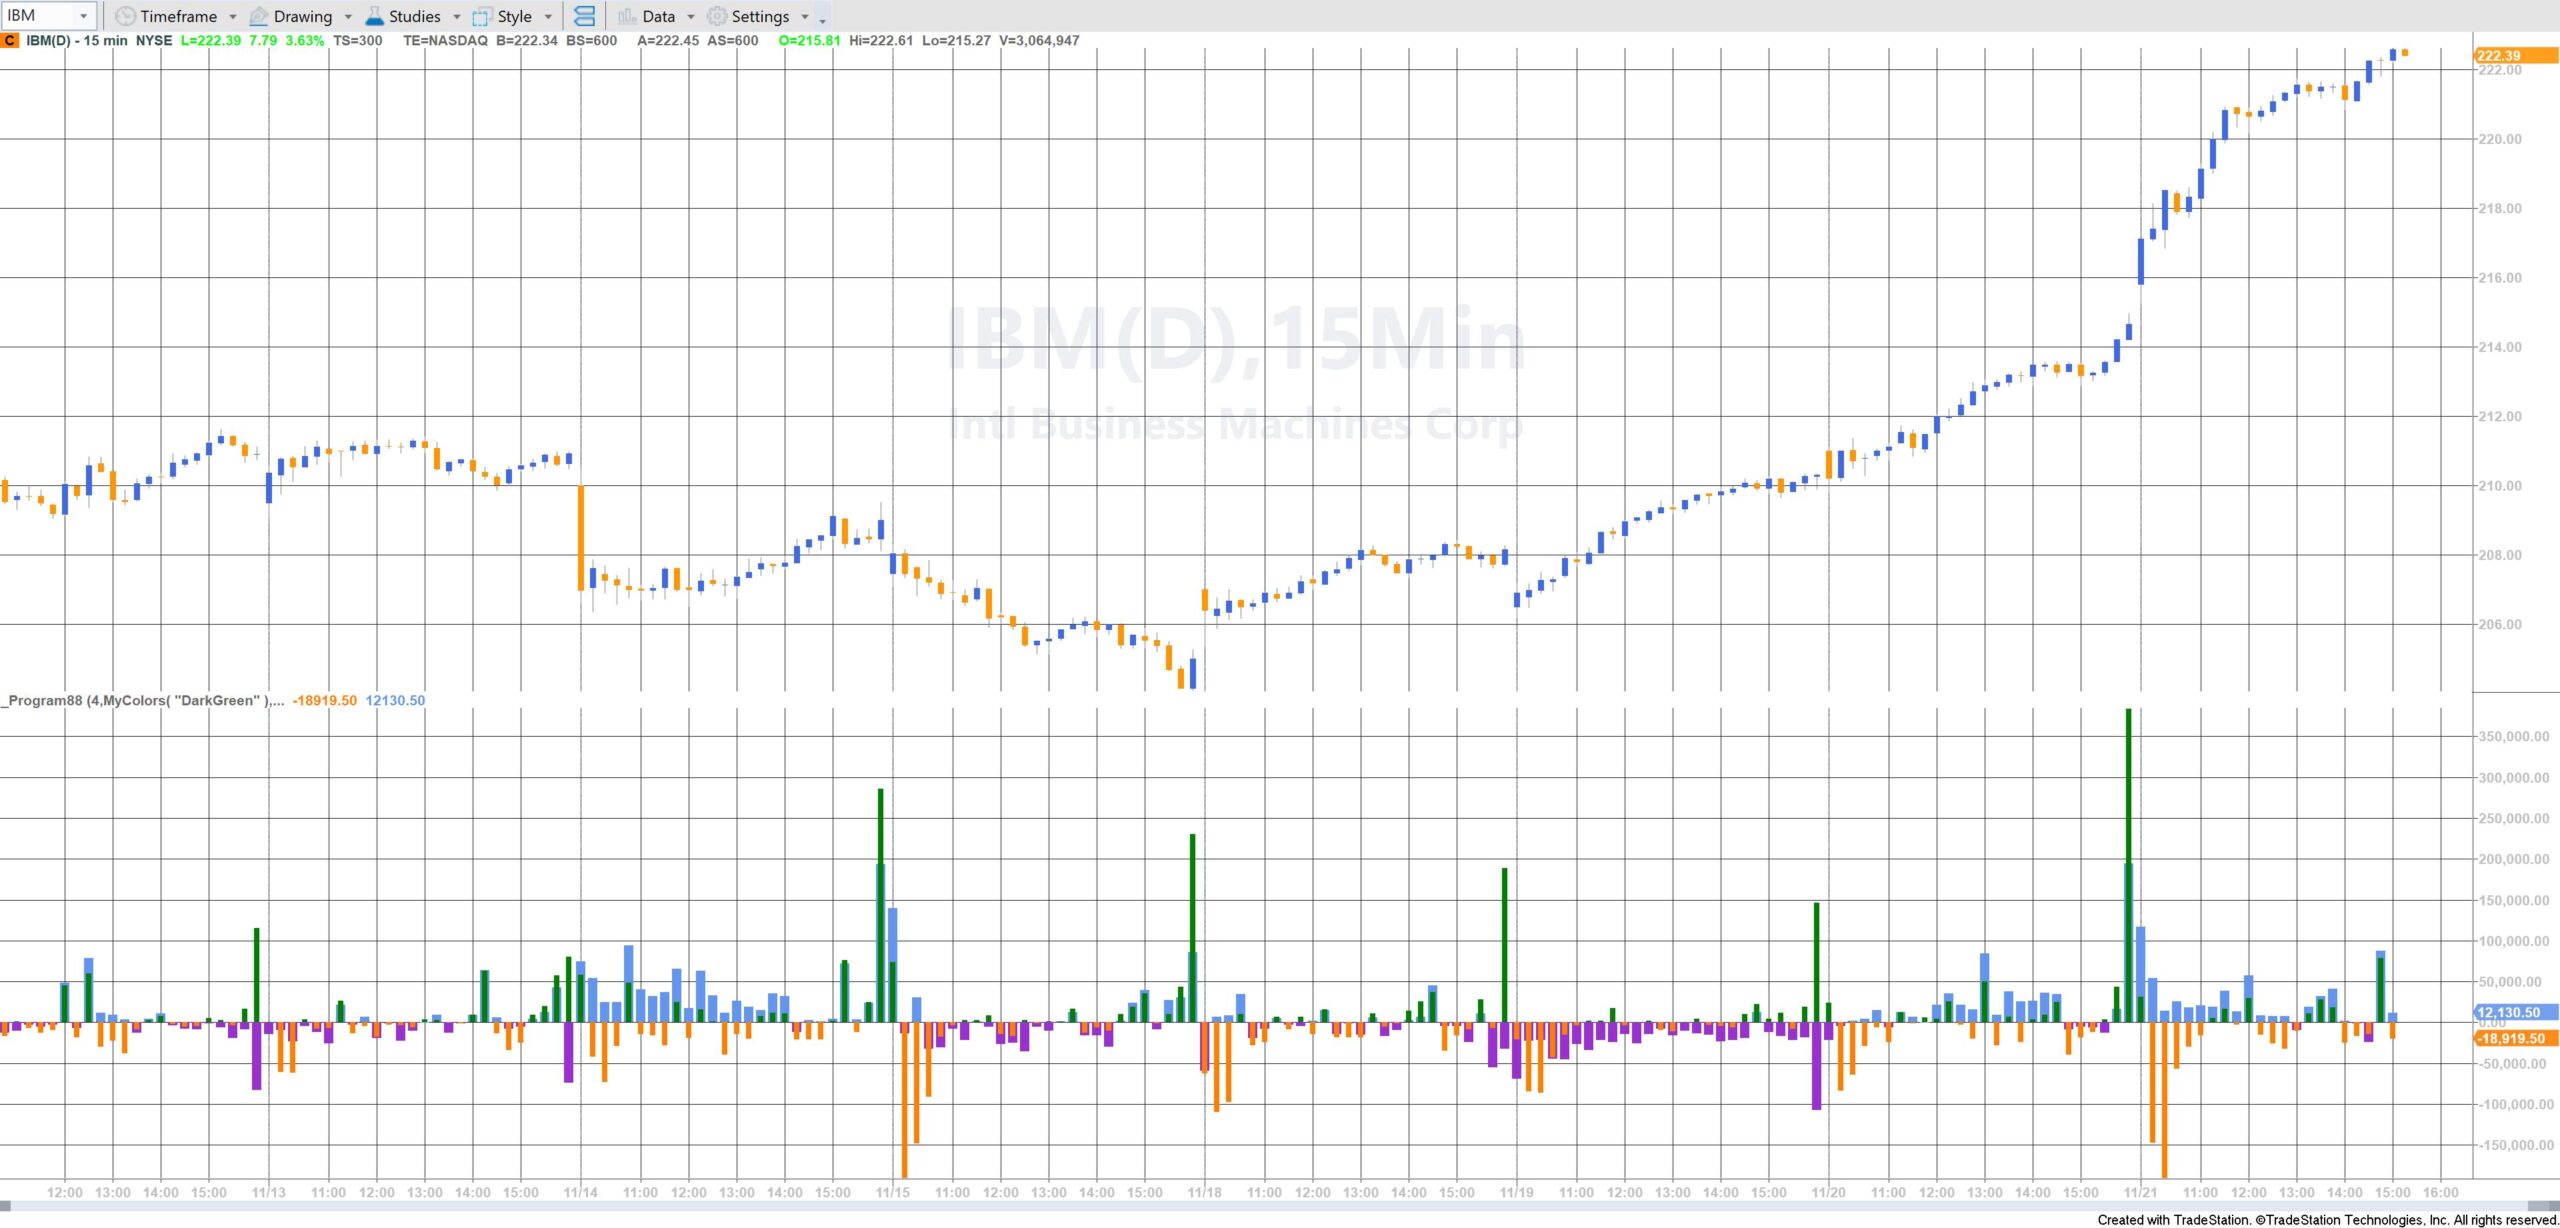
Program 88 calculates and plots the Markplex Relative Volume. For daily, weekly and monthly bars this is calculated by subtracting the moving average of the volume from the Current volume. This value is plotted.
For minute bars the average is calculated in two different ways.
In the first the relative volume is calculated in the same way as for daily, weekly and monthly bars.
In the second approach the program stores the volume at a specific time for a user input (Length) number of previous occurences. For example, if Length is set to 4, for the 10:00 bar the program would store the volume for this bar, the volume of the previous 10:00 bar, the volume for the 10:00 bar before that and the one before that. The sum of these values is then averaged and thisaverage value is used to calculate the Markplex Relative Volume. It is designed to be used with Intraday, time-based bars (e.g. 1 min, 10 min, 60min etc )
The program uses the Dictionary and Vector classes. For each different bar time on the chart a ‘key’ is stored. For a new key a vector is created and stored as the associated value. As the same time/key is encountered again the volume is added to the vector. When the vector exceeds Length the element at the zero position (i.e. the oldest) is deleted.
N.B. In TradeStation the keywords associated with volume vary their function depending on context. For example, for electronically traded futures contracts (assuming “Trade Vol” selected for the symbol)
Volume: volume traded on Up Ticks
Ticks: Total Volume
UpTicks: Volume traded on Up Ticks
DownTicks: Volume traded on Down Ticks
OpenInt: Volume traded on Down Ticks

Applications of Relative Volume in Trading:
Identifying Breakouts: A sudden spike in relative volume can signal a breakout from a key support or resistance level. Traders may interpret this as confirmation that the price movement is strong and supported by increased participation in the market. For example, if a stock breaks through a resistance level with a high relative volume, it suggests that the breakout is being validated by higher-than-usual buying interest.
Spotting Reversals or Exhaustion: When a stock or asset experiences a significant move (either up or down) on very high relative volume, it may indicate that the move is overextended. In some cases, extremely high volume during a price rally could signal exhaustion, as the buying pressure could be running out. Conversely, high relative volume during a sharp decline might suggest panic selling or that the asset is oversold, indicating a potential reversal.
Confirming Trends: Relative volume can be used to confirm ongoing trends. For example, during an uptrend, increasing relative volume may indicate that the trend is strong and likely to continue. Conversely, decreasing relative volume during an uptrend could suggest weakening momentum, which might precede a trend reversal or consolidation.
Volume Divergence: Traders often watch for discrepancies between price and volume. For example, if the price of an asset is making new highs but the relative volume is declining, it may suggest that the rally is not supported by strong buying interest, which could be a warning sign that the trend is losing strength. On the other hand, price making new highs with increasing relative volume suggests a healthy trend.
Evaluating Market Sentiment: Relative volume can give insights into market sentiment. For example, if a news event (such as an earnings report) causes a dramatic increase in relative volume, it suggests that the market is reacting strongly to the news. Traders can use this information to gauge whether the market sentiment is positive or negative.


Technical lessons
The tutorial is NOT compatible with MultiCharts.
The program has been thoroughly tested, however, please report any software bugs.
TO THE BEST OF MARKPLEX CORPORATION’S KNOWLEDGE, ALL OF THE INFORMATION ON THIS PAGE IS CORRECT, AND IT IS PROVIDED IN THE HOPE THAT IT WILL BE USEFUL. HOWEVER, MARKPLEX CORPORATION ASSUMES NO LIABILITY FOR ANY DAMAGES, DIRECT OR OTHERWISE, RESULTING FROM THE USE OF THIS INFORMATION AND/OR PROGRAM(S) DESCRIBED, AND NO WARRANTY IS MADE REGARDING ITS ACCURACY OR COMPLETENESS. USE OF THIS INFORMATION AND/OR PROGRAMS DESCRIBED IS AT YOUR OWN RISK.
ANY EASYLANGUAGE OR POWERLANGUAGE TRADING STRATEGIES, SIGNALS, STUDIES, INDICATORS, SHOWME STUDIES, PAINTBAR STUDIES, PROBABILITYMAP STUDIES, ACTIVITYBAR STUDIES, FUNCTIONS (AND PARTS THEREOF) AND ASSOCIATED TECHNIQUES REFERRED TO, INCLUDED IN OR ATTACHED TO THIS TUTORIAL OR PROGRAM DESCRIPTION ARE EXAMPLES ONLY, AND HAVE BEEN INCLUDED SOLELY FOR EDUCATIONAL PURPOSES. MARKPLEX CORPORATION. DOES NOT RECOMMEND THAT YOU USE ANY SUCH TRADING STRATEGIES, SIGNALS, STUDIES, INDICATORS, SHOWME STUDIES, PAINTBAR STUDIES, PROBABILITYMAP STUDIES, ACTIVITYBAR STUDIES, FUNCTIONS (OR ANY PARTS THEREOF) OR TECHNIQUES. THE USE OF ANY SUCH TRADING STRATEGIES, SIGNALS, STUDIES, INDICATORS, SHOWME STUDIES, PAINTBAR STUDIES, PROBABILITYMAP STUDIES, ACTIVITYBAR STUDIES, FUNCTIONS AND TECHNIQUES DOES NOT GUARANTEE THAT YOU WILL MAKE PROFITS, INCREASE PROFITS, OR MINIMIZE LOSSES.

