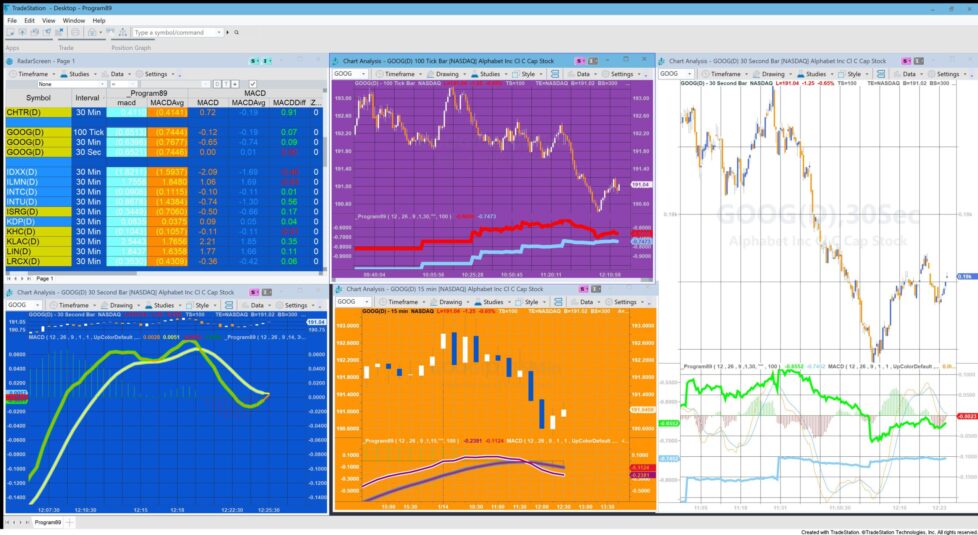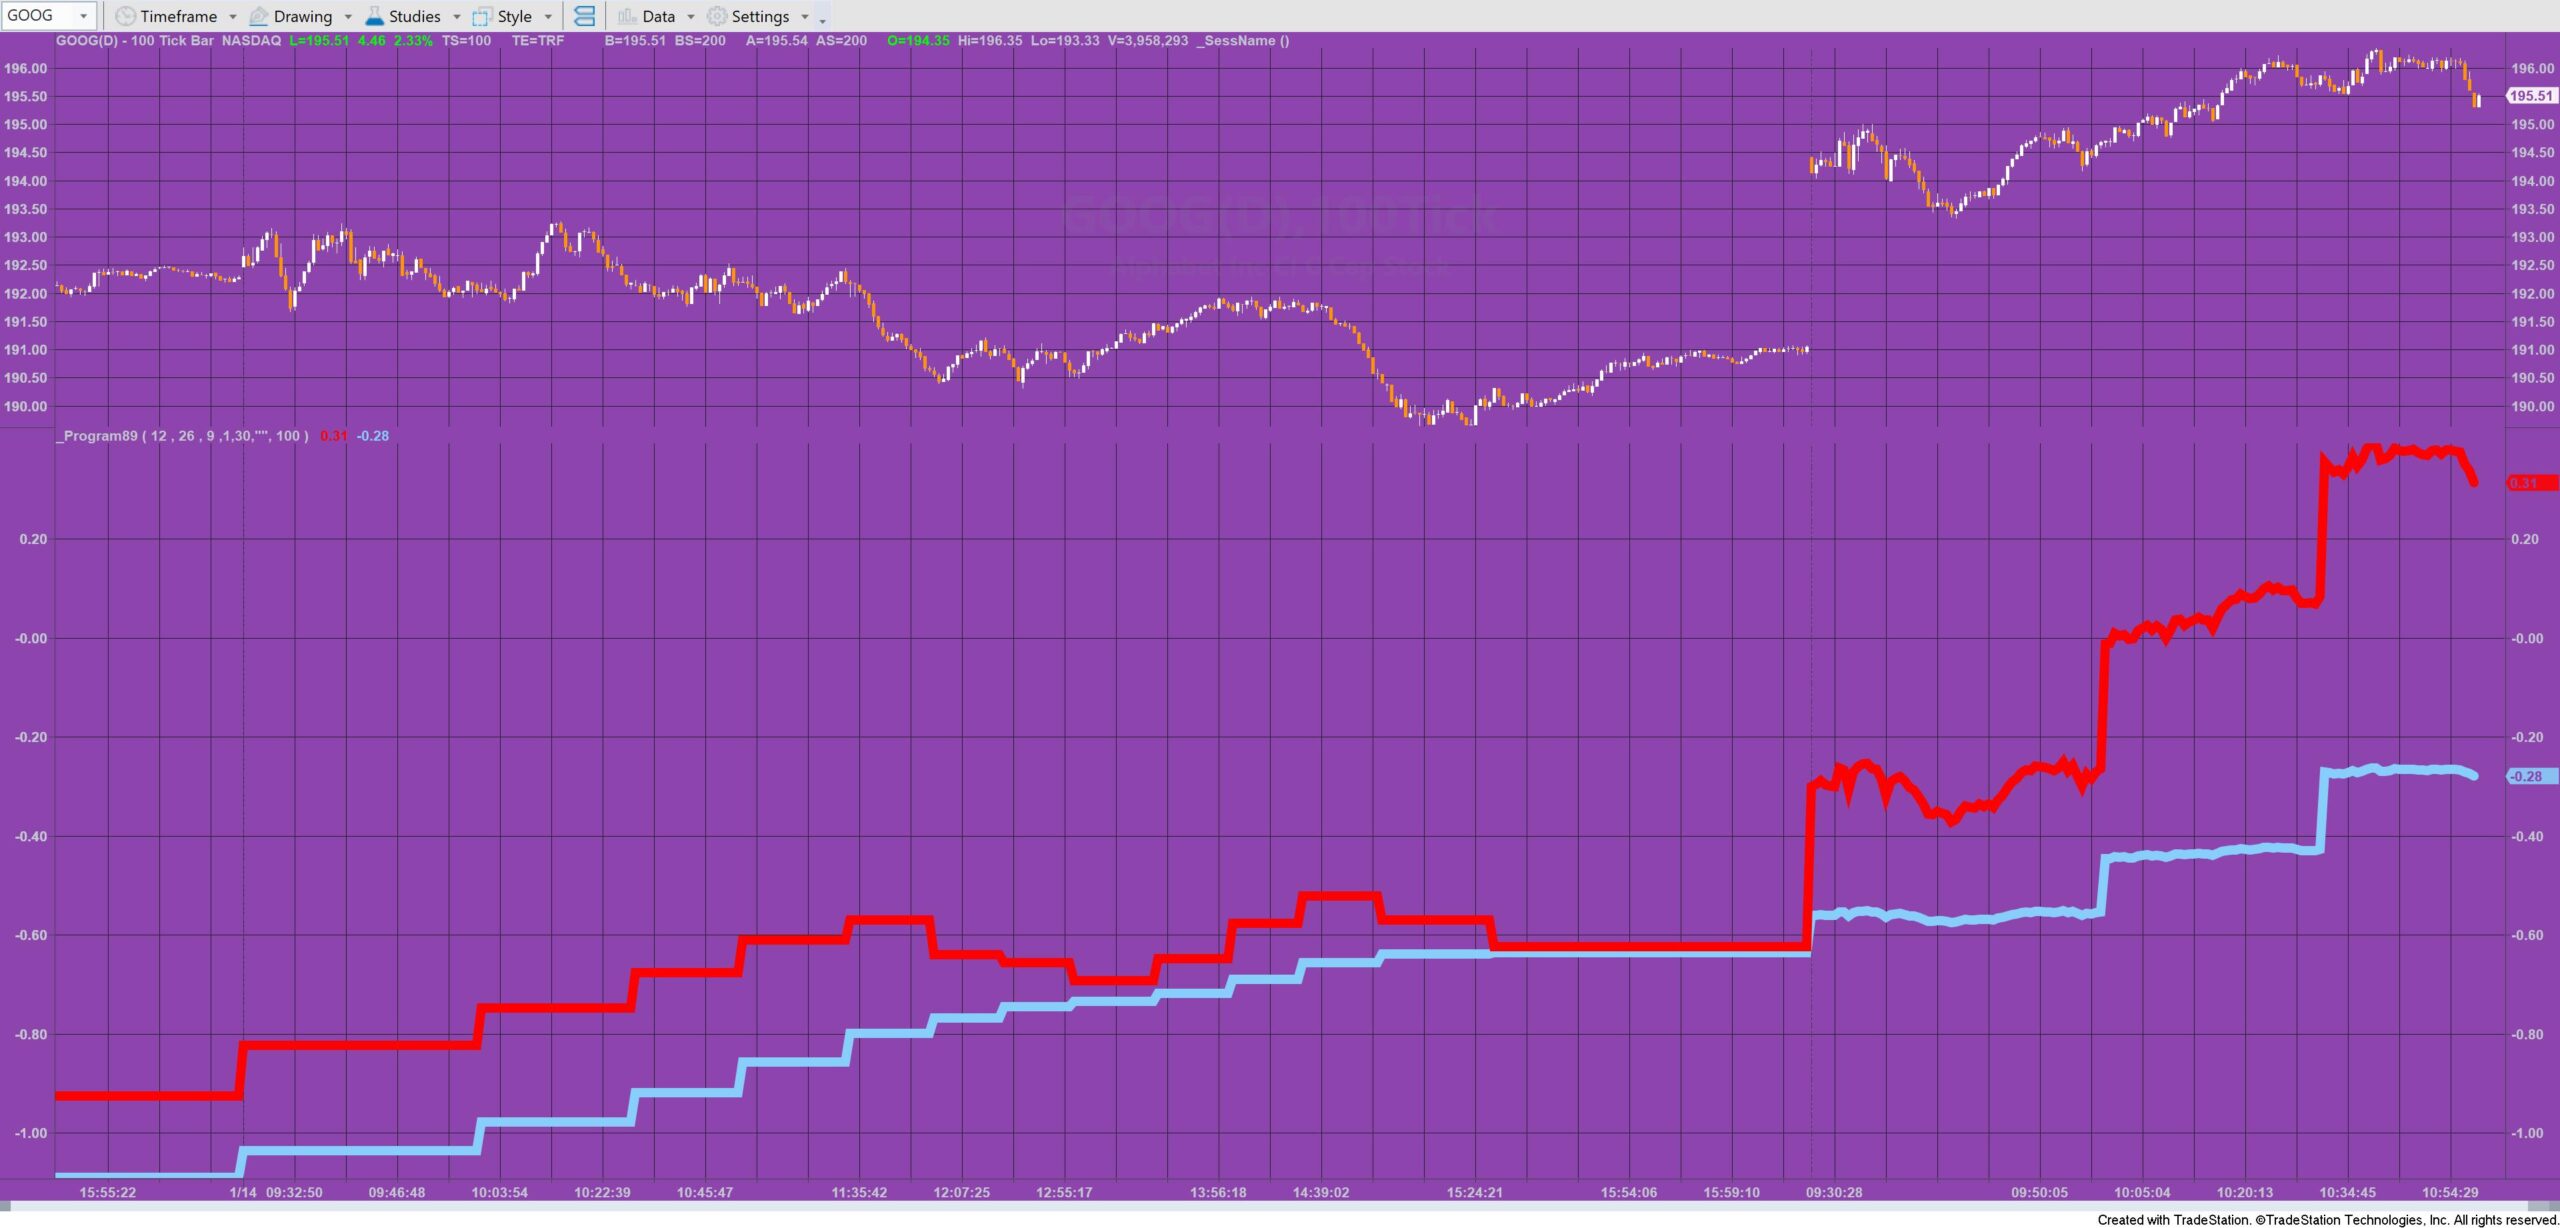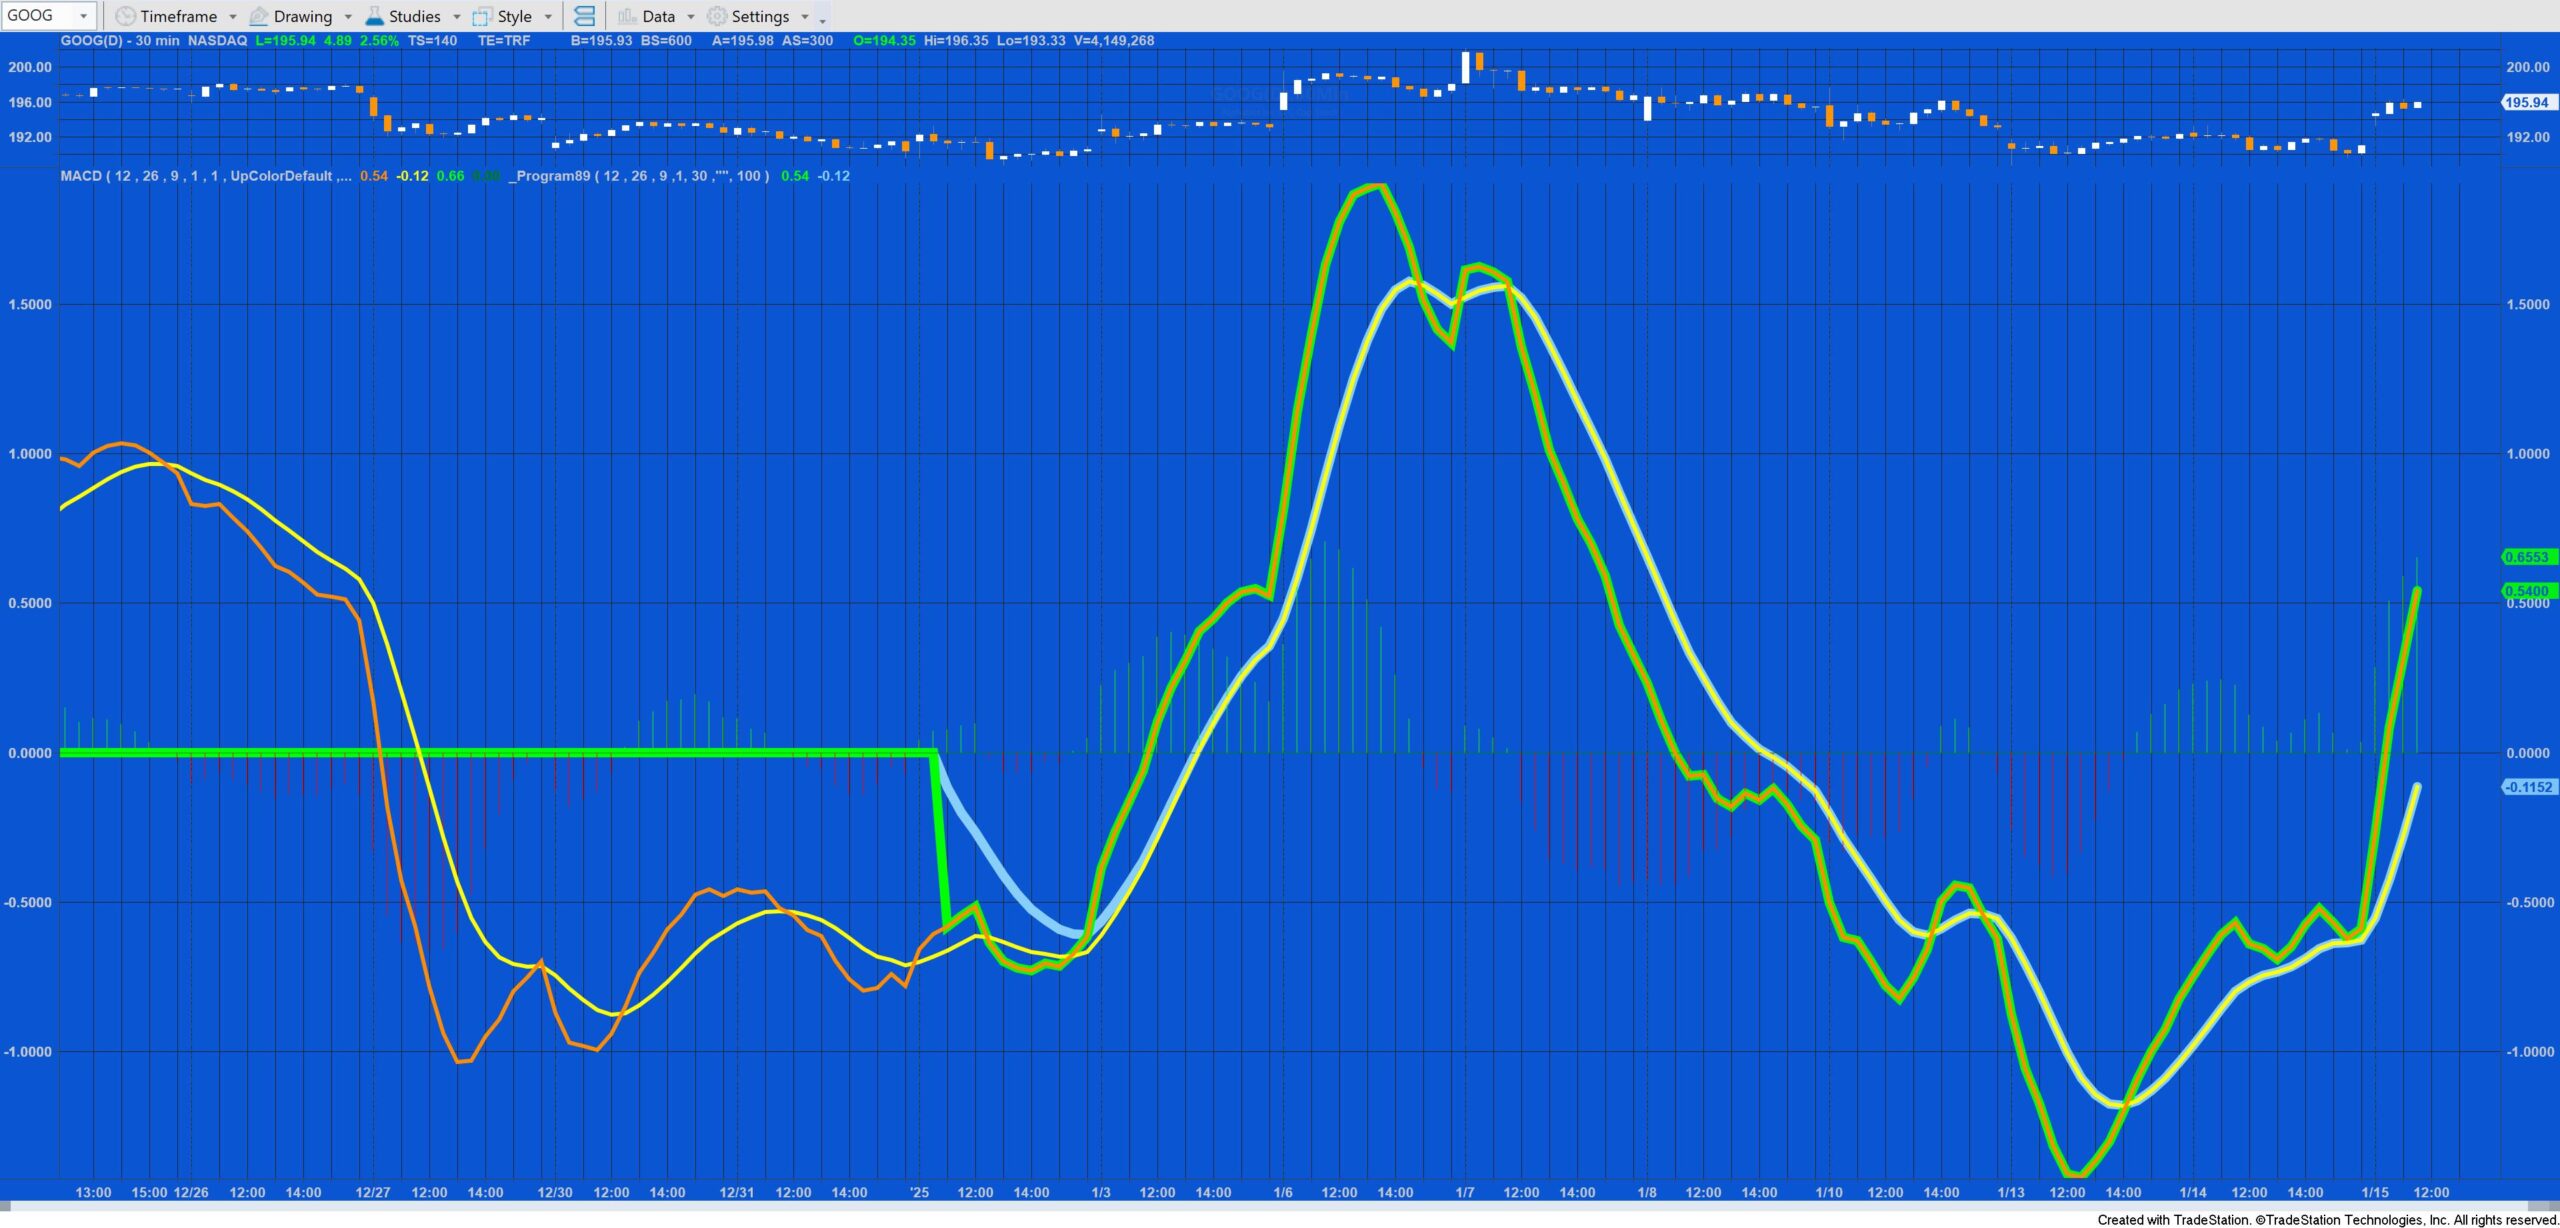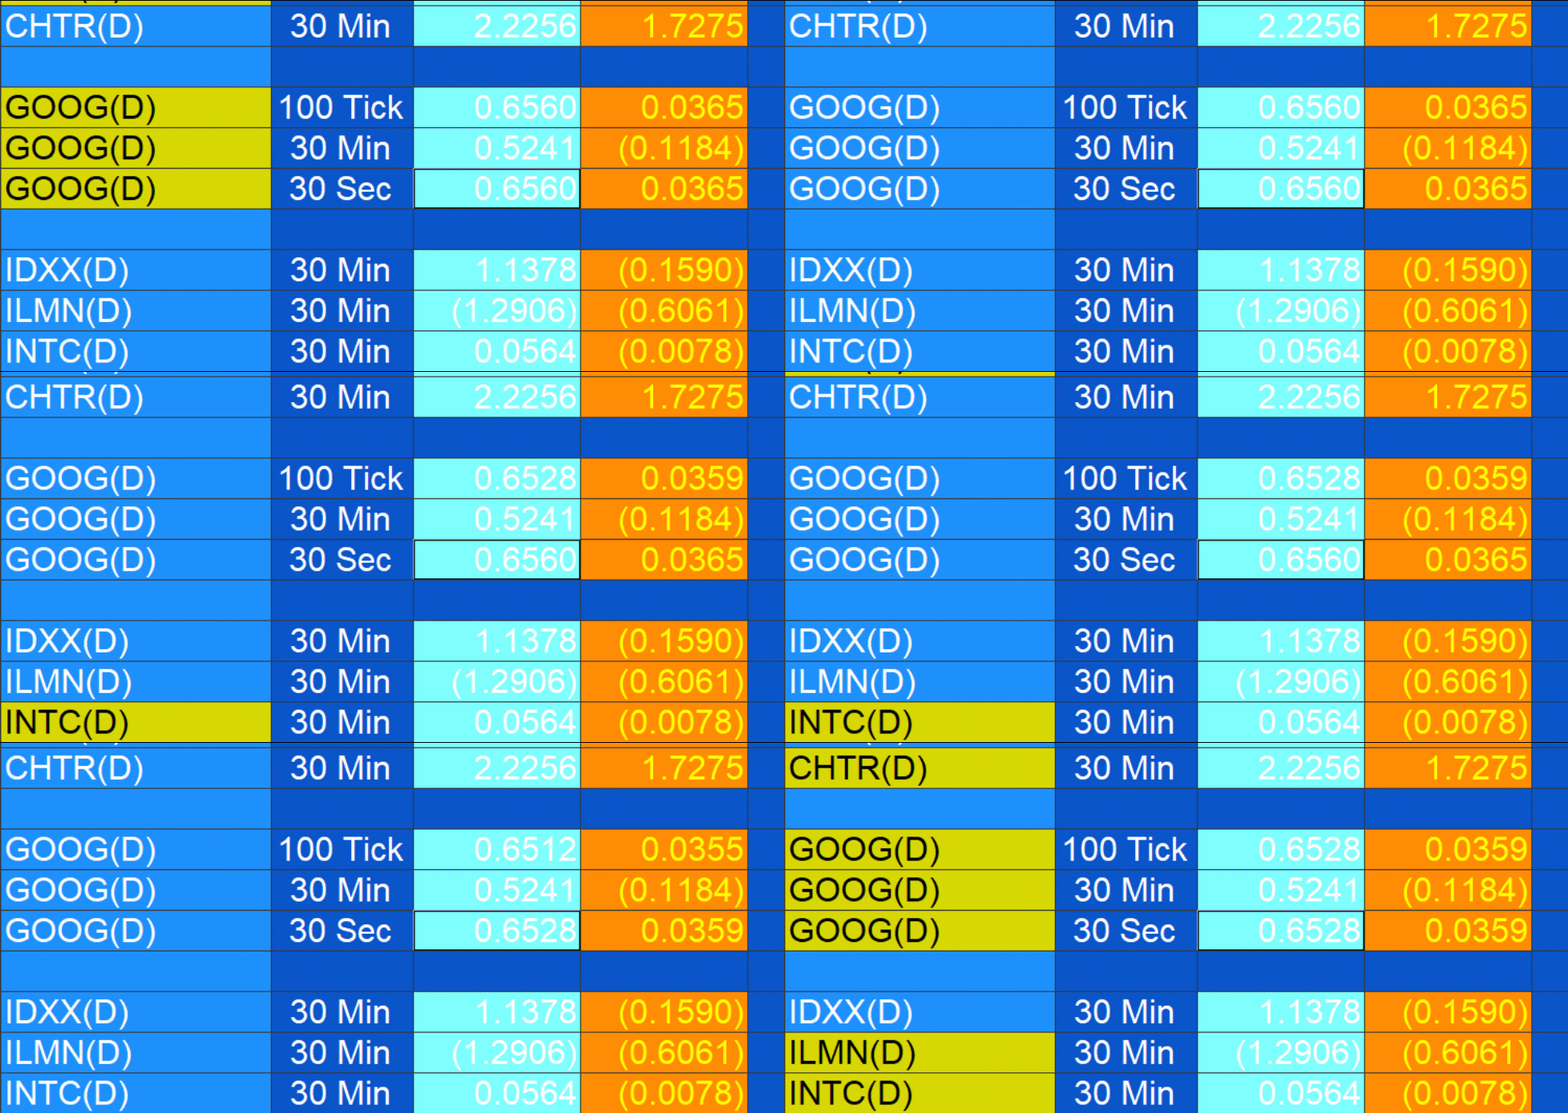
Program 89 is designed to calculate the MACD (Moving average convergence-divergence) indicator using a Price Series Provider (PSP).
The calculation for MACD is:
MACD = XAverage( Price, FastLength ) - XAverage( Price, SlowLength );
Because this program is designed to calculate the MACD for a minutes bar (e.g. 30 minutes) but be applied to a smaller timeframe bar (e.g. 20 seconds), a price series provider (PSP) needs to be used.
The standard Tradestation EMA (XAverage) function using regular data starts calculating on the first bar of the chart. The next bar uses the value of the previous bar (which in turn used the values of the previous bar) and so on up to the current bar. The XAverage function uses the following code:
XAverage = XAverage[1] + SmoothingFactor * ( Price - XAverage[1] );
where XAverage[1] refers to the value of XAverage one bar ago.
Instead of accumulating the values for every bar program 89 counts back a number of bars and then does the calculation for the exponential moving average using the following:
XAv = PSP.Close[BarsBack - 1]; // Set initial value
For Value1 = BarsBack - 1 downto 0
Begin
XAv = XAv + ( 2 / ( Length + 1 ) * ( PSP.Close[Value1] - XAv ) );
End;
The slow moving average is subtracted from the fast moving average to give the MACD.
To calculate the average of the MACD we need to recalculate the MACD for the last BarsBack Bars each time s value is calculated, and store the results in a vector (XAvVect). Another method (CalcXAVVect) is then used to calculate the XAverage of the values in the vector.
A PSP object and price are not tightly synchronized, however the PSP does make sure that it does not expose information that is more recent than the bar being calculated. This enables the above calculation. It appears that with some time frame combinations that PSP is less well synchronized than others which causes some small differences in the EMA calculation.
The calculation for the exponential moving average is put into a method and this method is called at the end of each bar.
When using RadarScreen make sure that you enter some bars in the “Load Additional Bars” setting.
When testing the program it is useful to set up a chart for the longer timeframe (e.g. 15 minutes) this program and the standard MACD indicator should be applied to the chart. The settings for this program should match the chart. So if applied to a 15 minute chart DataIntType should be set to 1 and IntSpan to 15. The values calculated by this program and the standard MACD indicator can then be compared with each other. This program that then be applied to a smaller bar (i.e. 30 seconds).
The inputs should remain the same (DataIntType: 1 and IntSpan: 15) and the values of the MACD and the average MACD can then be compared.
Make sure that both charts have the time zone is the same for both charts.

Applications of MACD in Trading:
The MACD (Moving Average Convergence Divergence) indicator is a versatile tool in technical analysis that can be used for several purposes, including:
Trend Identification: By analyzing the relationship between the MACD line and the smoothed moving average of the MACD line (known as the signal line), traders can identify the prevailing market trend.
Momentum Analysis: The MACD histogram helps assess the strength of price momentum, indicating potential buying or selling opportunities.
Divergence/Convergence: MACD can signal potential reversals when the indicator diverges or converges with price movements, suggesting changes in trend direction.
Crossovers: A MACD line crossing above or below the signal line can indicate buy or sell signals, respectively.
Overall, the MACD is used to spot trends, measure momentum, and identify potential entry or exit points.


Technical lessons
The tutorial is NOT compatible with MultiCharts.
The program has been thoroughly tested, however, please report any software bugs. Program 89 works on minute, seconds and tick charts with a minute (e.g. 30 minute, 15 minute etc) bar in the PSP.
TO THE BEST OF MARKPLEX CORPORATION’S KNOWLEDGE, ALL OF THE INFORMATION ON THIS PAGE IS CORRECT, AND IT IS PROVIDED IN THE HOPE THAT IT WILL BE USEFUL. HOWEVER, MARKPLEX CORPORATION ASSUMES NO LIABILITY FOR ANY DAMAGES, DIRECT OR OTHERWISE, RESULTING FROM THE USE OF THIS INFORMATION AND/OR PROGRAM(S) DESCRIBED, AND NO WARRANTY IS MADE REGARDING ITS ACCURACY OR COMPLETENESS. USE OF THIS INFORMATION AND/OR PROGRAMS DESCRIBED IS AT YOUR OWN RISK.
ANY EASYLANGUAGE OR POWERLANGUAGE TRADING STRATEGIES, SIGNALS, STUDIES, INDICATORS, SHOWME STUDIES, PAINTBAR STUDIES, PROBABILITYMAP STUDIES, ACTIVITYBAR STUDIES, FUNCTIONS (AND PARTS THEREOF) AND ASSOCIATED TECHNIQUES REFERRED TO, INCLUDED IN OR ATTACHED TO THIS TUTORIAL OR PROGRAM DESCRIPTION ARE EXAMPLES ONLY, AND HAVE BEEN INCLUDED SOLELY FOR EDUCATIONAL PURPOSES. MARKPLEX CORPORATION. DOES NOT RECOMMEND THAT YOU USE ANY SUCH TRADING STRATEGIES, SIGNALS, STUDIES, INDICATORS, SHOWME STUDIES, PAINTBAR STUDIES, PROBABILITYMAP STUDIES, ACTIVITYBAR STUDIES, FUNCTIONS (OR ANY PARTS THEREOF) OR TECHNIQUES. THE USE OF ANY SUCH TRADING STRATEGIES, SIGNALS, STUDIES, INDICATORS, SHOWME STUDIES, PAINTBAR STUDIES, PROBABILITYMAP STUDIES, ACTIVITYBAR STUDIES, FUNCTIONS AND TECHNIQUES DOES NOT GUARANTEE THAT YOU WILL MAKE PROFITS, INCREASE PROFITS, OR MINIMIZE LOSSES.

