
Program 9 is a smoothed, low-lag Commodity Channel Index (CCI) TradeStation EasyLanguage indicator. The following images show the smoothed Markplex CCI indicator, compared with the CCI indicator supplied with TradeStation.
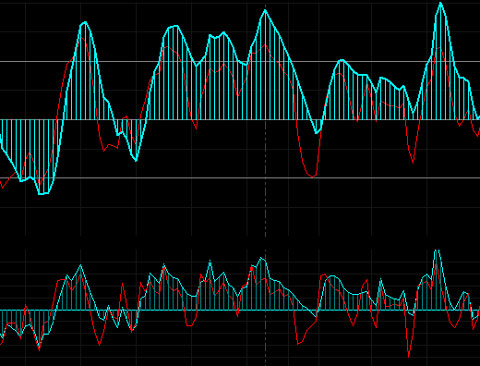
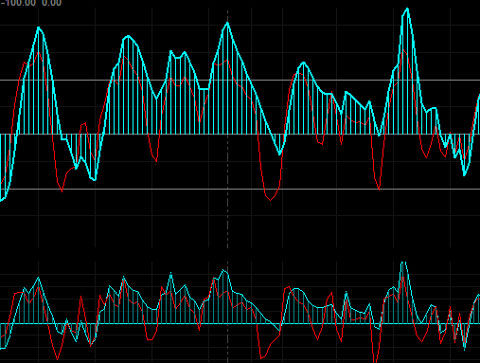
The amount of lag depends on the smoothing factor applied. In the next image the SmoothLength is reduced to 9, reducing the lag but still retaining a smoother plot.
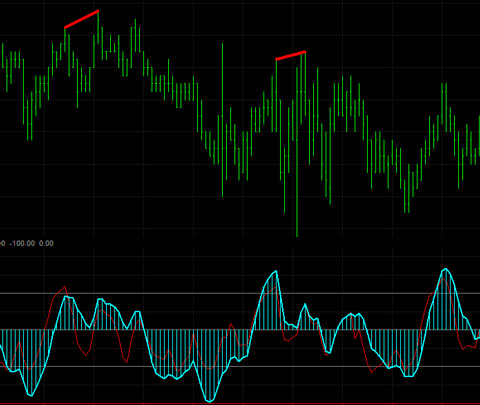
The program also includes the option to look for divergence between price and the smoothed CCI plot. If a divergence is detected, a line is drawn under the price pivots. See the following image.
See a video demonstration below.
This protected program (i.e. the TradeStation EasyLanguage indicator) is available for immediate download for $44.95 by clicking the ‘add to cart’ button to pay using credit card or PayPal. The program is also available for MultiCharts. Please select the version you need.
The program was developed in TradeStation 8.7 and works on intraday, daily, weekly, and monthly charts.
See the video below for more information.
User inputs
ShowLines( TRUE ), // If TRUE draws lines to illustrate potential divergences
LowerLine( -100 ), // Used to draw horizontal line at the user input level
UpperLine( 100 ), // Used to draw horizontal line at the user input level
CCIColor( DarkGray ), // If ‘legacy’ CCI drawn, specify its color
ShowRegularCCI( TRUE ), // If TRUE ‘legacy’ CCI drawn
CCIFastColor( Red ), // Color of fast smoothed CCI
SmoothCCIColor( Cyan ), // Color of smoothed CCI
HorizLines( DarkGray ), // Color of horizontal lines
CCILength( 14 ), // CCI length
FastLength( 6 ), // Length of ‘fast’ CCI
SmoothLength( 14 ), // Factor used to smooth CCI
FastSmoothLength( 14 ), // Factor used to smooth fast CCI
Length ( 20 ), // Lookback length when looking for pivots (used to find divergences)
LeftStrength( 3 ), // Left strength of pivots
RightStrength( 1 ), //Right strength of pivots
BarTol( 3 ), // The number of bars within which the price and CCI pivot must occur for the pivots to be considered to have occurred at the same time
PriceL( Low ), // Price used to find low pivots
PriceH( High ); // Price used to find high pivots
TO THE BEST OF MARKPLEX CORPORATION’S KNOWLEDGE, ALL OF THE INFORMATION ON THIS PAGE IS CORRECT, AND IT IS PROVIDED IN THE HOPE THAT IT WILL BE USEFUL. HOWEVER, MARKPLEX CORPORATION ASSUMES NO LIABILITY FOR ANY DAMAGES, DIRECT OR OTHERWISE, RESULTING FROM THE USE OF THIS INFORMATION AND/OR PROGRAM(S) DESCRIBED, AND NO WARRANTY IS MADE REGARDING ITS ACCURACY OR COMPLETENESS. USE OF THIS INFORMATION AND/OR PROGRAMS DESCRIBED IS AT YOUR OWN RISK.
ANY EASYLANGUAGE OR POWERLANGUAGE TRADING STRATEGIES, SIGNALS, STUDIES, INDICATORS, SHOWME STUDIES, PAINTBAR STUDIES, PROBABILITYMAP STUDIES, ACTIVITYBAR STUDIES, FUNCTIONS (AND PARTS THEREOF) AND ASSOCIATED TECHNIQUES REFERRED TO, INCLUDED IN OR ATTACHED TO THIS TUTORIAL OR PROGRAM DESCRIPTION ARE EXAMPLES ONLY, AND HAVE BEEN INCLUDED SOLELY FOR EDUCATIONAL PURPOSES. MARKPLEX CORPORATION. DOES NOT RECOMMEND THAT YOU USE ANY SUCH TRADING STRATEGIES, SIGNALS, STUDIES, INDICATORS, SHOWME STUDIES, PAINTBAR STUDIES, PROBABILITYMAP STUDIES, ACTIVITYBAR STUDIES, FUNCTIONS (OR ANY PARTS THEREOF) OR TECHNIQUES. THE USE OF ANY SUCH TRADING STRATEGIES, SIGNALS, STUDIES, INDICATORS, SHOWME STUDIES, PAINTBAR STUDIES, PROBABILITYMAP STUDIES, ACTIVITYBAR STUDIES, FUNCTIONS AND TECHNIQUES DOES NOT GUARANTEE THAT YOU WILL MAKE PROFITS, INCREASE PROFITS, OR MINIMIZE LOSSES.
This protected program (i.e. the TradeStation EasyLanguage indicator) is available for immediate download for $44.95 by clicking the ‘add to cart’ button to pay using credit card or PayPal. The program is also available for MultiCharts. Please select the version you need.
The program was developed in TradeStation 8.7 and works on intraday, daily, weekly, and monthly charts.
To install and use in MultiCharts, download the program and save it to your disk, then open the MultiCharts PowerLanguage Editor and click File then Import Read-Only, select the file (_program9.sef), click ok. You should then be able to insert the study on to a chart in MultiCharts.
Video demonstration of Program 9
This protected program (i.e. the TradeStation EasyLanguage indicator) is available for immediate download for $44.95 by clicking the ‘add to cart’ button to pay using credit card or PayPal. The program is also available for MultiCharts. Please select the version you need.
The program is ‘protected,’ (or ‘read-only’ in the case of the MultiCharts version) in other words, you will not be able to see and edit the source code, but you will be able to apply it to a chart and modify the inputs.
Please email any bugs that you may discover to support@markplex.com.
TO THE BEST OF MARKPLEX CORPORATION’S KNOWLEDGE, ALL OF THE INFORMATION ON THIS PAGE IS CORRECT, AND IT IS PROVIDED IN THE HOPE THAT IT WILL BE USEFUL. HOWEVER, MARKPLEX CORPORATION ASSUMES NO LIABILITY FOR ANY DAMAGES, DIRECT OR OTHERWISE, RESULTING FROM THE USE OF THIS INFORMATION AND/OR PROGRAM(S) DESCRIBED, AND NO WARRANTY IS MADE REGARDING ITS ACCURACY OR COMPLETENESS. USE OF THIS INFORMATION AND/OR PROGRAMS DESCRIBED IS AT YOUR OWN RISK.
ANY EASYLANGUAGE OR POWERLANGUAGE TRADING STRATEGIES, SIGNALS, STUDIES, INDICATORS, SHOWME STUDIES, PAINTBAR STUDIES, PROBABILITYMAP STUDIES, ACTIVITYBAR STUDIES, FUNCTIONS (AND PARTS THEREOF) AND ASSOCIATED TECHNIQUES REFERRED TO, INCLUDED IN OR ATTACHED TO THIS TUTORIAL OR PROGRAM DESCRIPTION ARE EXAMPLES ONLY, AND HAVE BEEN INCLUDED SOLELY FOR EDUCATIONAL PURPOSES. MARKPLEX CORPORATION. DOES NOT RECOMMEND THAT YOU USE ANY SUCH TRADING STRATEGIES, SIGNALS, STUDIES, INDICATORS, SHOWME STUDIES, PAINTBAR STUDIES, PROBABILITYMAP STUDIES, ACTIVITYBAR STUDIES, FUNCTIONS (OR ANY PARTS THEREOF) OR TECHNIQUES. THE USE OF ANY SUCH TRADING STRATEGIES, SIGNALS, STUDIES, INDICATORS, SHOWME STUDIES, PAINTBAR STUDIES, PROBABILITYMAP STUDIES, ACTIVITYBAR STUDIES, FUNCTIONS AND TECHNIQUES DOES NOT GUARANTEE THAT YOU WILL MAKE PROFITS, INCREASE PROFITS, OR MINIMIZE LOSSES.