

This TradeStation EasyLanguage program is designed to assist traders in identifying potential trade entry zones by analyzing key oscillator behavior. The script monitors several popular momentum indicators—including %R, MACD Histogram, Commodity Channel Index (CCI), and Stochastic Oscillator—for the formation of “hooks” or pivot points that occur beyond overbought or oversold thresholds. The values of the overbought and oversold levels are set using user inputs.
A hook is defined here as a local turning point in the oscillator’s movement, signaling a possible shift in momentum. When two such hooks occur consecutively in the same extreme zone (either overbought or oversold), the oscillator is flagged with a visual plot on the chart. If the oscillator subsequently crosses back through the overbought or oversold line within a user defined number of bars, an additional plot is drawn.
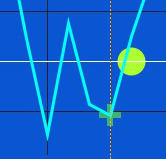
In the image on the right, an initial ‘hook’ has occurred (not marked). A second hook has occurred within a user input number of bars and is marked with a cross. When the oscillator subsequently crosses over the oversold line a dot is drawn. The style and color of these plots can be easily modified by the user.
By highlighting these recurring patterns, this tool aims to give traders an early visual cue of potential momentum reversals. It’s not a standalone trading signal, but rather a contextual aid to support broader technical analysis and decision-making.
Built in CCI, %R, MACD, TSI and RSI. The oscillator is chosen by changing the WhichOsc input and the inputs relevant to a specific oscillator. For example, to select the Commodity Channel Index (CCI), you would change WhichOsc to 7 and then modify the CCILength input.
The oscillator options are as follows:
1 MACD
2 MACDAvg
3 MACDDiff
4 PercentR
5 RSI1
6 RSI2
7 CCI
8 Fast CCI
9 SmoothCCI
10 SmoothCCIFast
11 TSI (True Strength Index)
12 Exp Avg TSI
So, for example, if the user wanted to analyze SmoothCCIFast for ‘hooks,’ then the WhichOsc input would be set to 10.
User might wish a analyze several oscillators at the same time. This can be done by applying program 90 to the chart several times, each with different user inputs.
This program is designed to looks for ‘hooks’ (i.e. pivots) in the included oscillators. When a low pivot is found the program checks if it is equal to or lower than the user input oSold level. If so, the bar number and value of the hook are stored in a two dimensional array (LowPivots). Similarly, when a high pivot is found the program checks if it is equal to or greater than the user input oBought level. If so the bar number and value of the hook are stored in another two dimensional array (HiPivots).
When a low ‘hook’ is found and added to the low array (LowPivots), the program then analyzes the array to see if the number of bars between the last two low pivots is less or equal to the MaxBarsBetween input. If so, the latest low pivot (hook) is plotted ( Plot14 ). Similarly, when a high ‘hook’ is found and added to the high array (HiPivots), the program then analyzes the array to see if the number of bars between the last two high pivots is less or equal to the MaxBarsBetween input. If so, the latest high pivot (hook) is plotted (Plot15).
When the oscillator crosses above the oSold level and the last low hook occurred less than the MaxBarsBeforeBrk value then a plot is made (Plot25). Similarly when the oscillator crosses below the oBought level and the last high hook occurred less than the MaxBarsBeforeBrk value then a plot is made (Plot26).
The color and style of the plots can be modified by getting to the ‘customize study’ screen and then modifying the color and style for each plot. Should you wish these values to become the default when you use next apply the program, click the default button and verify the program (see the video below).

The program evaluates a selection of commonly used oscillators, each offering a distinct view of market momentum. %R is a momentum indicator that measures overbought and oversold levels by comparing the current closing price to the high-low range over a specified period. CCI (Commodity Channel Index) quantifies the deviation of the price from its statistical mean, highlighting cyclical turning points. MACD Histogram reflects the difference between the MACD line and its signal line, emphasizing changes in momentum. TSI (True Strength Index) is a double-smoothed momentum oscillator that helps filter out short-term noise while identifying longer-term trend reversals. RSI (Relative Strength Index) measures the speed and change of price movements, typically used to identify overbought and oversold conditions.
For each oscillator, the program detects inflection points or “hooks” that form above or below predefined overbought/oversold levels. When two such pivot structures are found consecutively within an extreme zone, a plot is drawn. If the oscillator then crosses back through the threshold line, it is plotted again—signaling potential shifts in directional momentum.

Download program 90
The tutorial is NOT compatible with MultiCharts.
The program has been thoroughly tested, however, please report any software bugs.
TO THE BEST OF MARKPLEX CORPORATION’S KNOWLEDGE, ALL OF THE INFORMATION ON THIS PAGE IS CORRECT, AND IT IS PROVIDED IN THE HOPE THAT IT WILL BE USEFUL. HOWEVER, MARKPLEX CORPORATION ASSUMES NO LIABILITY FOR ANY DAMAGES, DIRECT OR OTHERWISE, RESULTING FROM THE USE OF THIS INFORMATION AND/OR PROGRAM(S) DESCRIBED, AND NO WARRANTY IS MADE REGARDING ITS ACCURACY OR COMPLETENESS. USE OF THIS INFORMATION AND/OR PROGRAMS DESCRIBED IS AT YOUR OWN RISK.
ANY EASYLANGUAGE OR POWERLANGUAGE TRADING STRATEGIES, SIGNALS, STUDIES, INDICATORS, SHOWME STUDIES, PAINTBAR STUDIES, PROBABILITYMAP STUDIES, ACTIVITYBAR STUDIES, FUNCTIONS (AND PARTS THEREOF) AND ASSOCIATED TECHNIQUES REFERRED TO, INCLUDED IN OR ATTACHED TO THIS TUTORIAL OR PROGRAM DESCRIPTION ARE EXAMPLES ONLY, AND HAVE BEEN INCLUDED SOLELY FOR EDUCATIONAL PURPOSES. MARKPLEX CORPORATION. DOES NOT RECOMMEND THAT YOU USE ANY SUCH TRADING STRATEGIES, SIGNALS, STUDIES, INDICATORS, SHOWME STUDIES, PAINTBAR STUDIES, PROBABILITYMAP STUDIES, ACTIVITYBAR STUDIES, FUNCTIONS (OR ANY PARTS THEREOF) OR TECHNIQUES. THE USE OF ANY SUCH TRADING STRATEGIES, SIGNALS, STUDIES, INDICATORS, SHOWME STUDIES, PAINTBAR STUDIES, PROBABILITYMAP STUDIES, ACTIVITYBAR STUDIES, FUNCTIONS AND TECHNIQUES DOES NOT GUARANTEE THAT YOU WILL MAKE PROFITS, INCREASE PROFITS, OR MINIMIZE LOSSES.