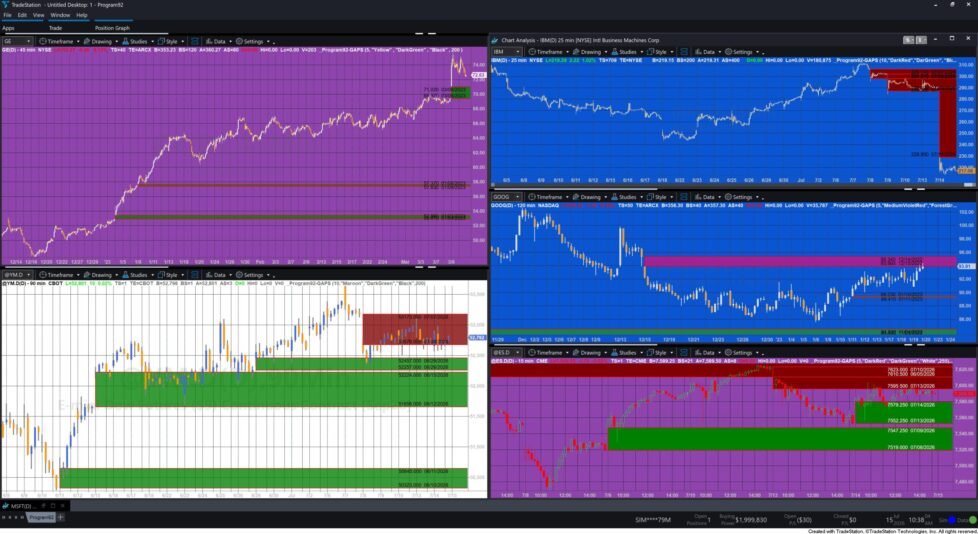
Gap show-me study for minute charts
This show-me study detects overnight gaps at the first bar of each trading day and draws a shaded rectangle representing the gap
Features:
• Detects both gap-up and gap-down opens.
• Draws an extending rectangle until the gap is filled.
• Displays labels showing the previous close and current open.
• Automatically removes the oldest gaps when NumGaps is exceeded.
• Deletes all graphics when a gap has been filled.
Designed for intraday minute charts ( 1, 5, 10, 15, 60, 120 minute etc)
Program description
This EasyLanguage show-me study is designed to identify and monitor overnight price gaps on intraday minute charts. A gap occurs when the opening price of a new trading session differs from the previous session’s closing price, leaving a gap in price on the chart where no trading occurred. The program is a remake of program 37, however rather than using the legacy EasyLanguage drawing tools, program 92 uses drawing objects.
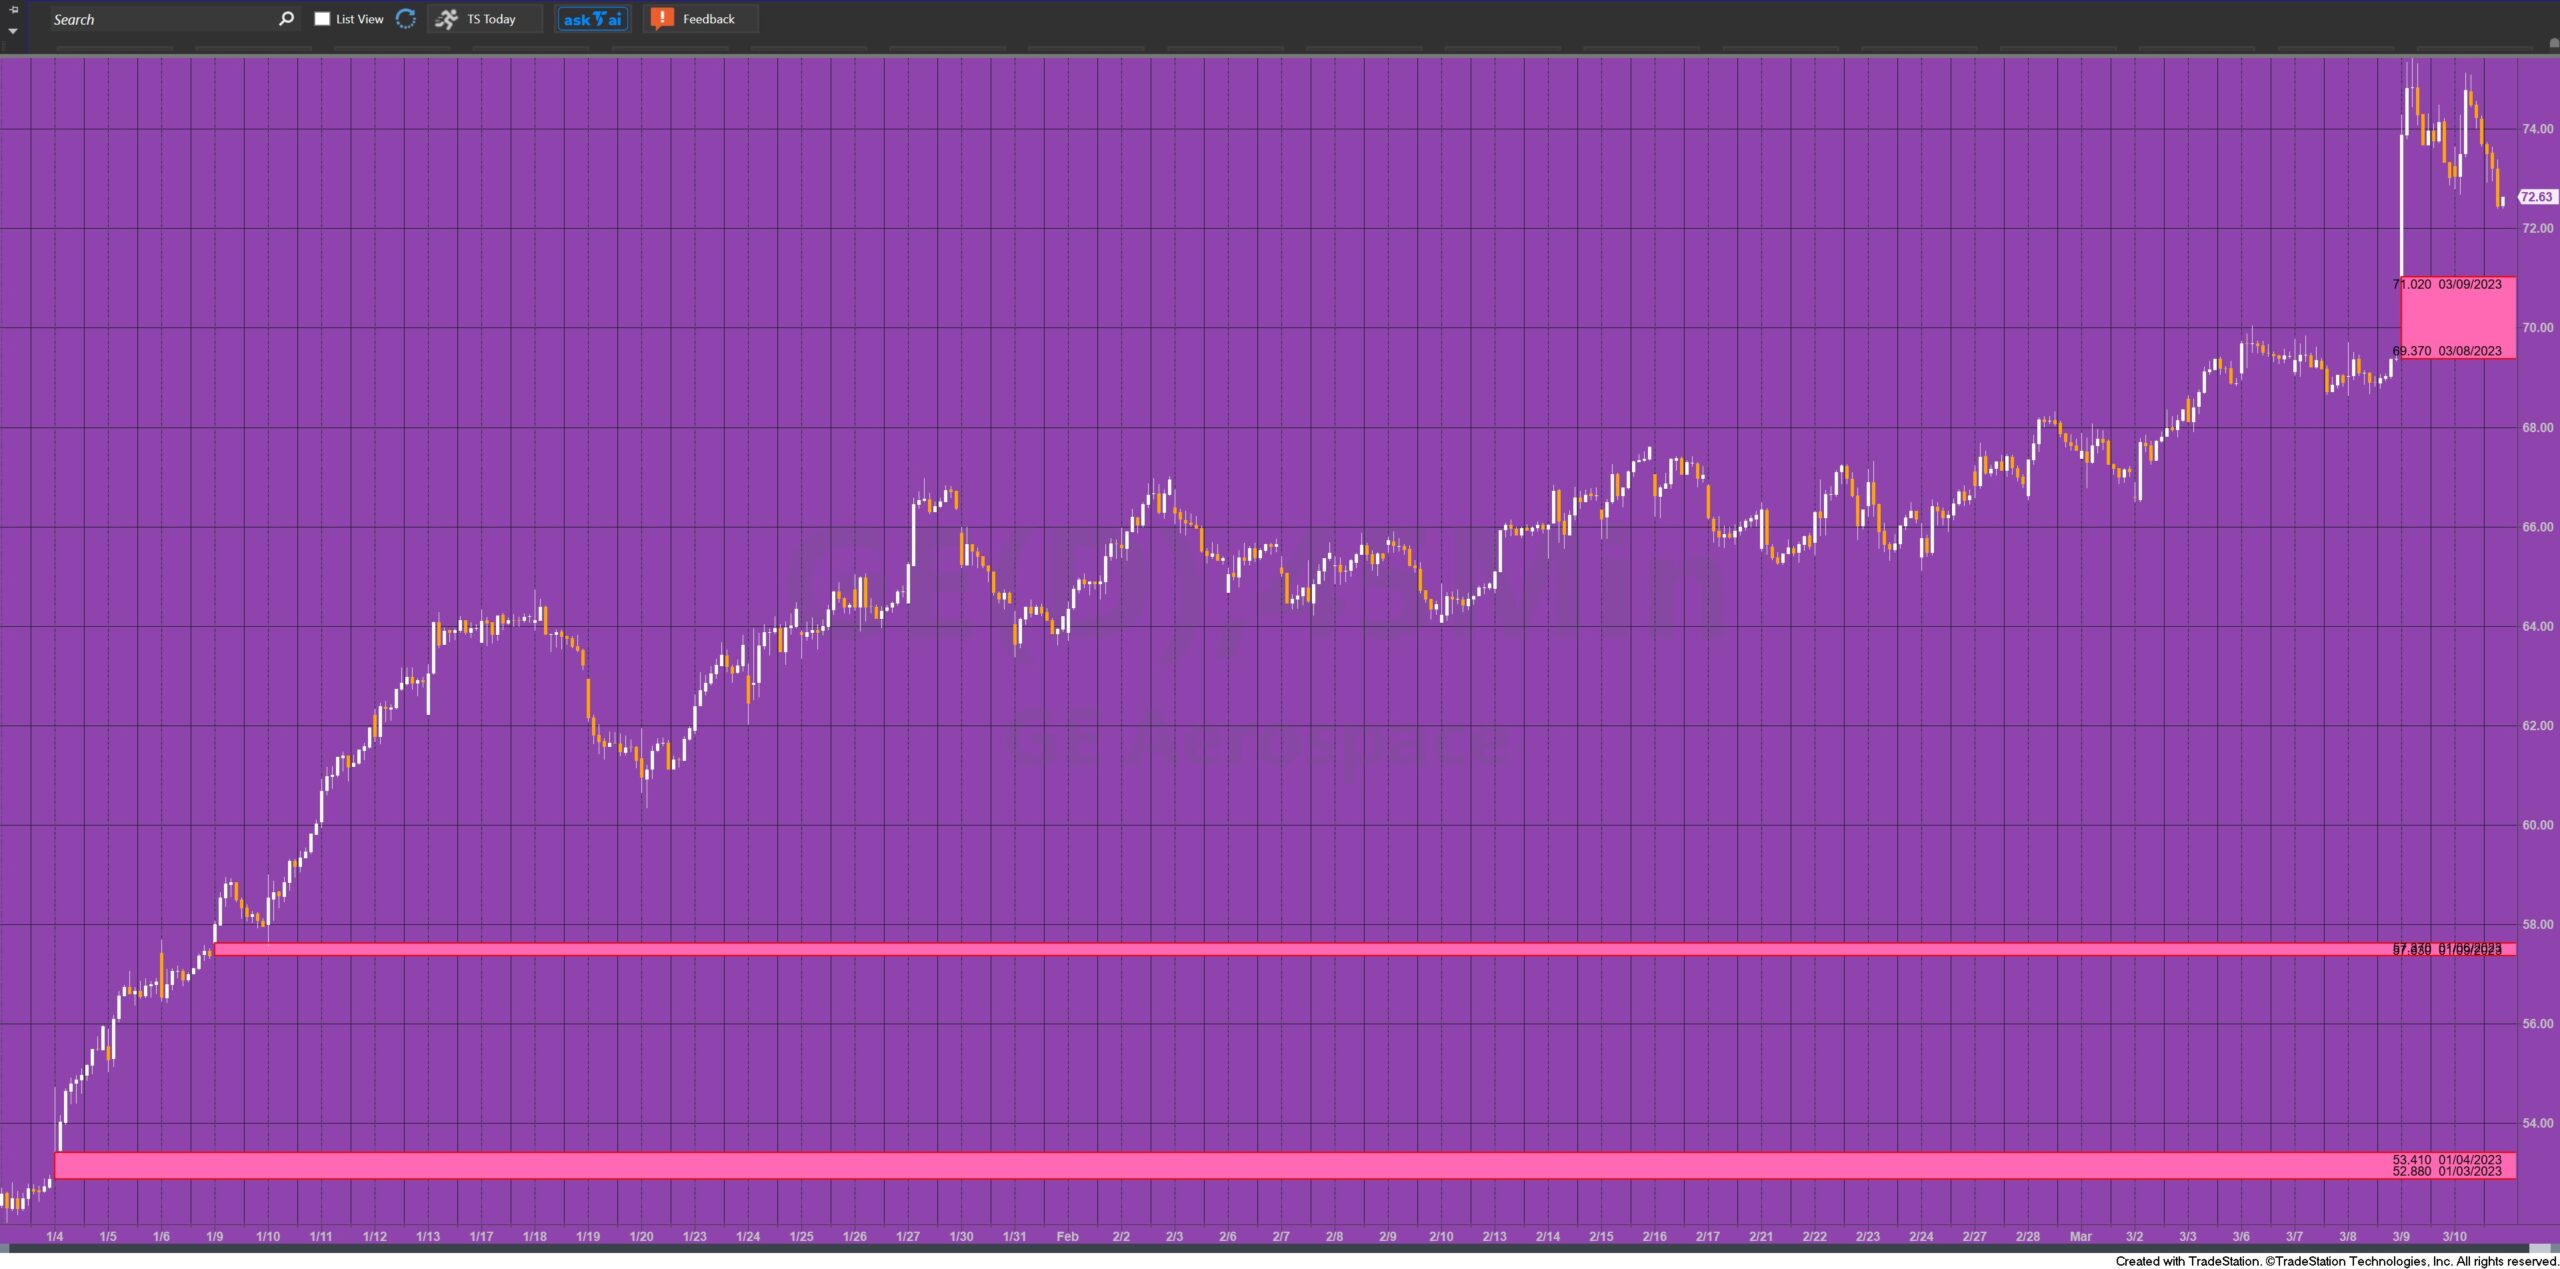
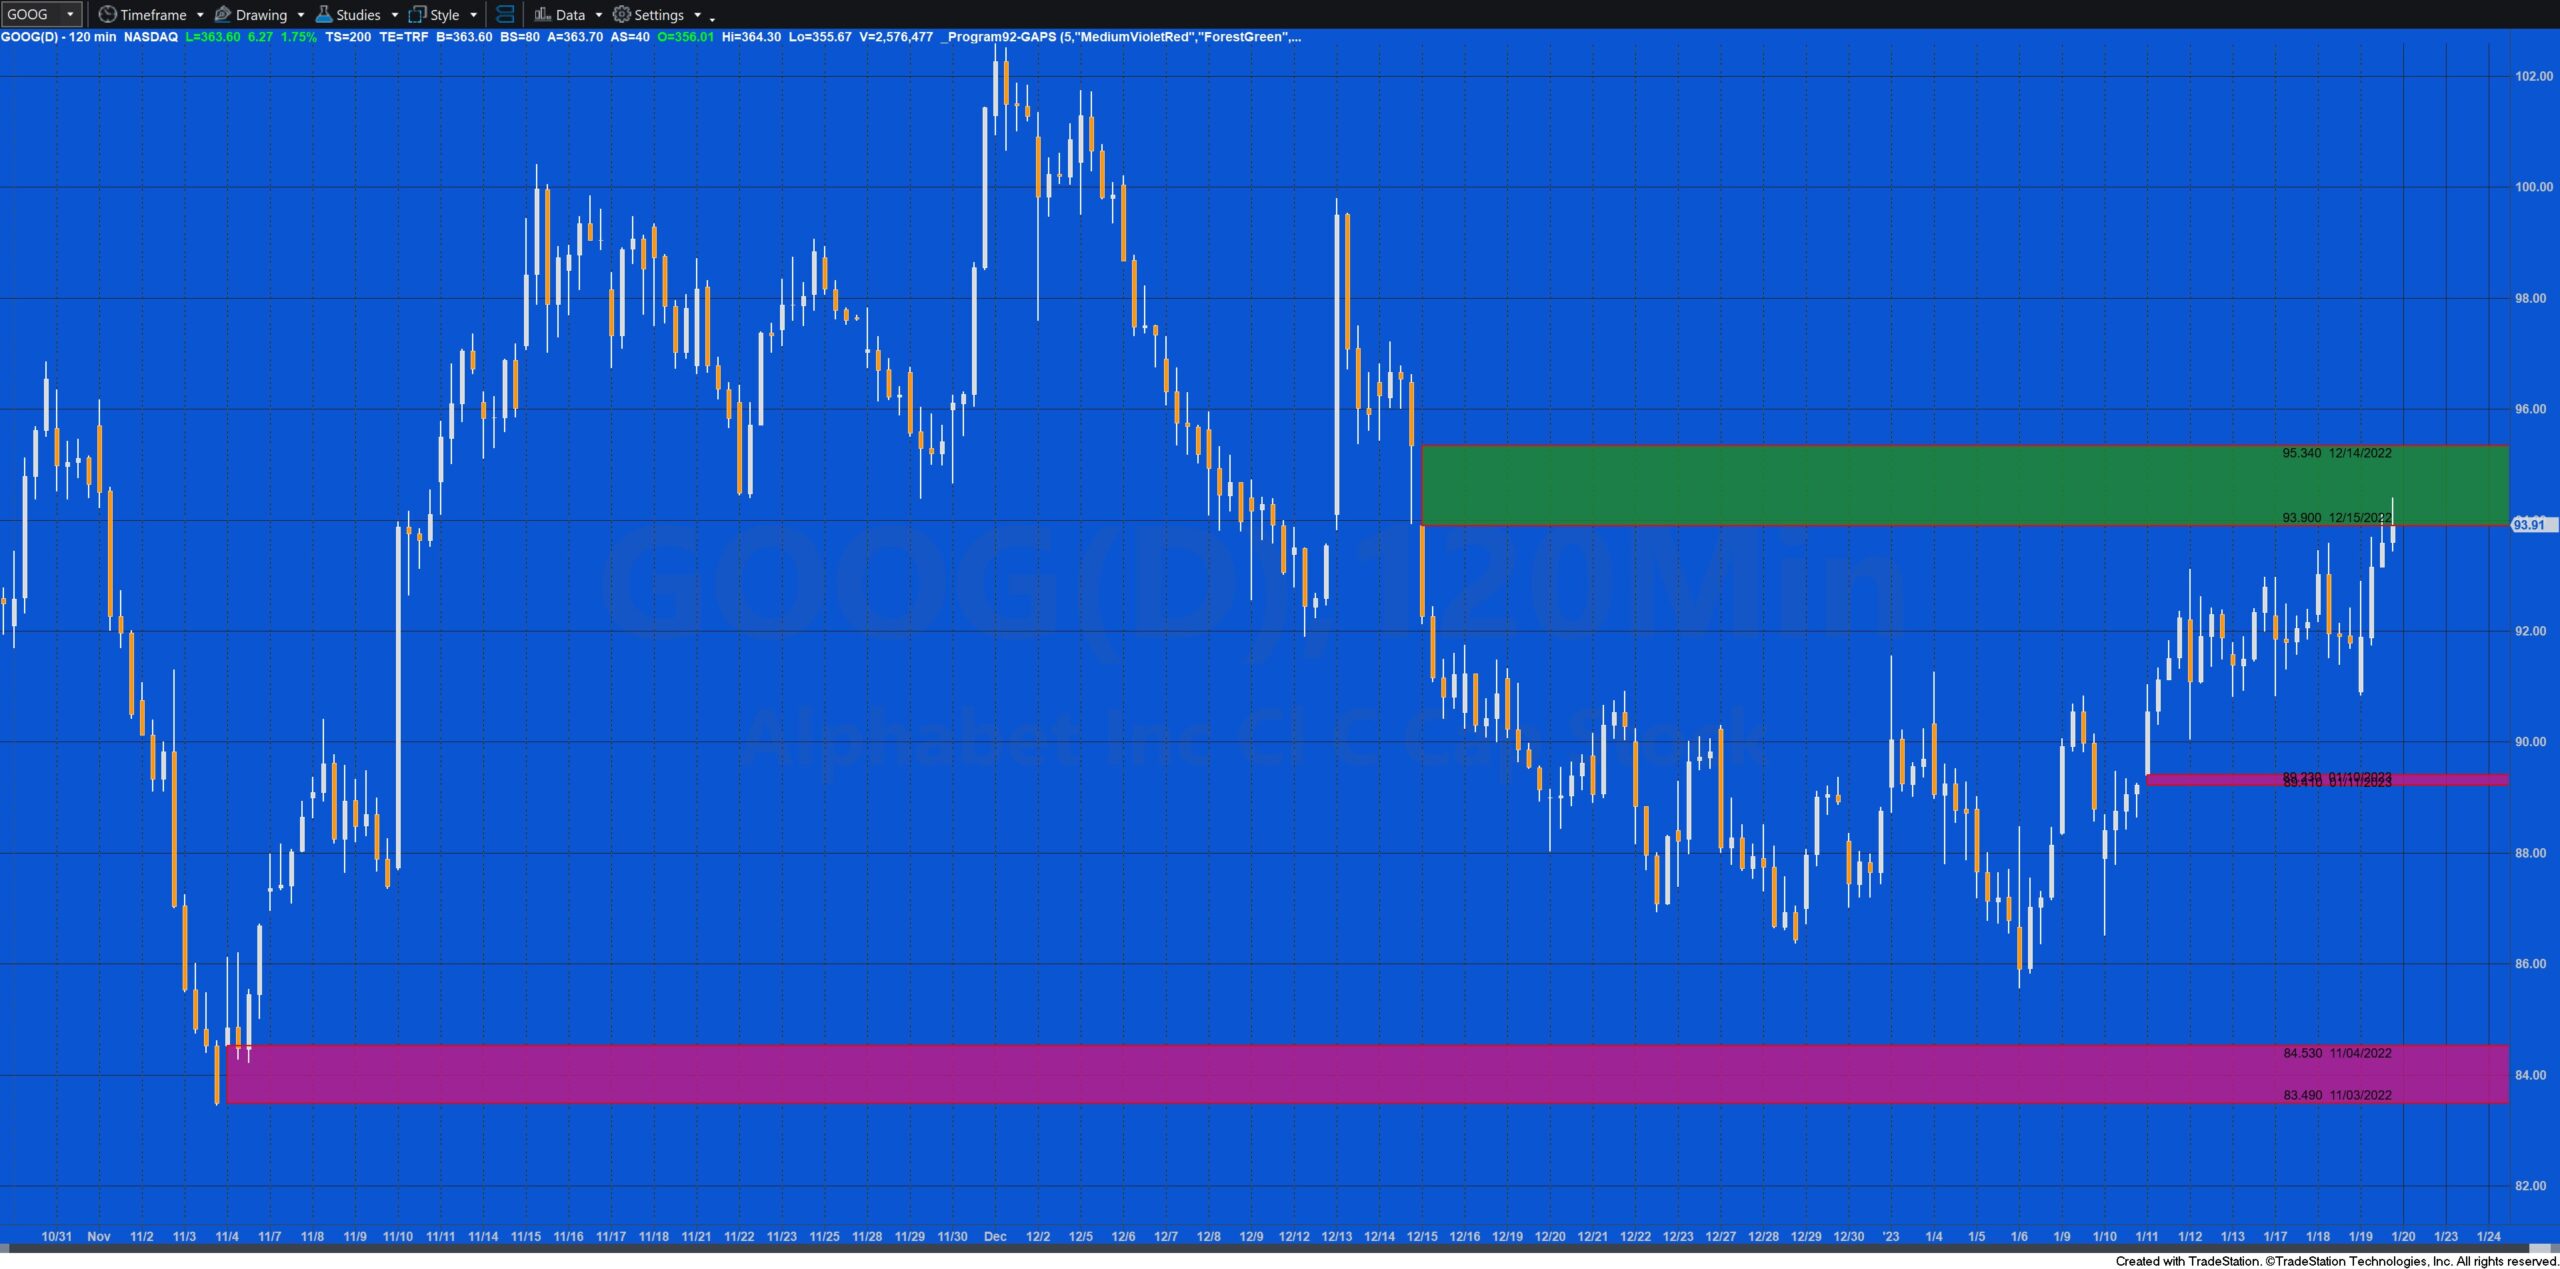
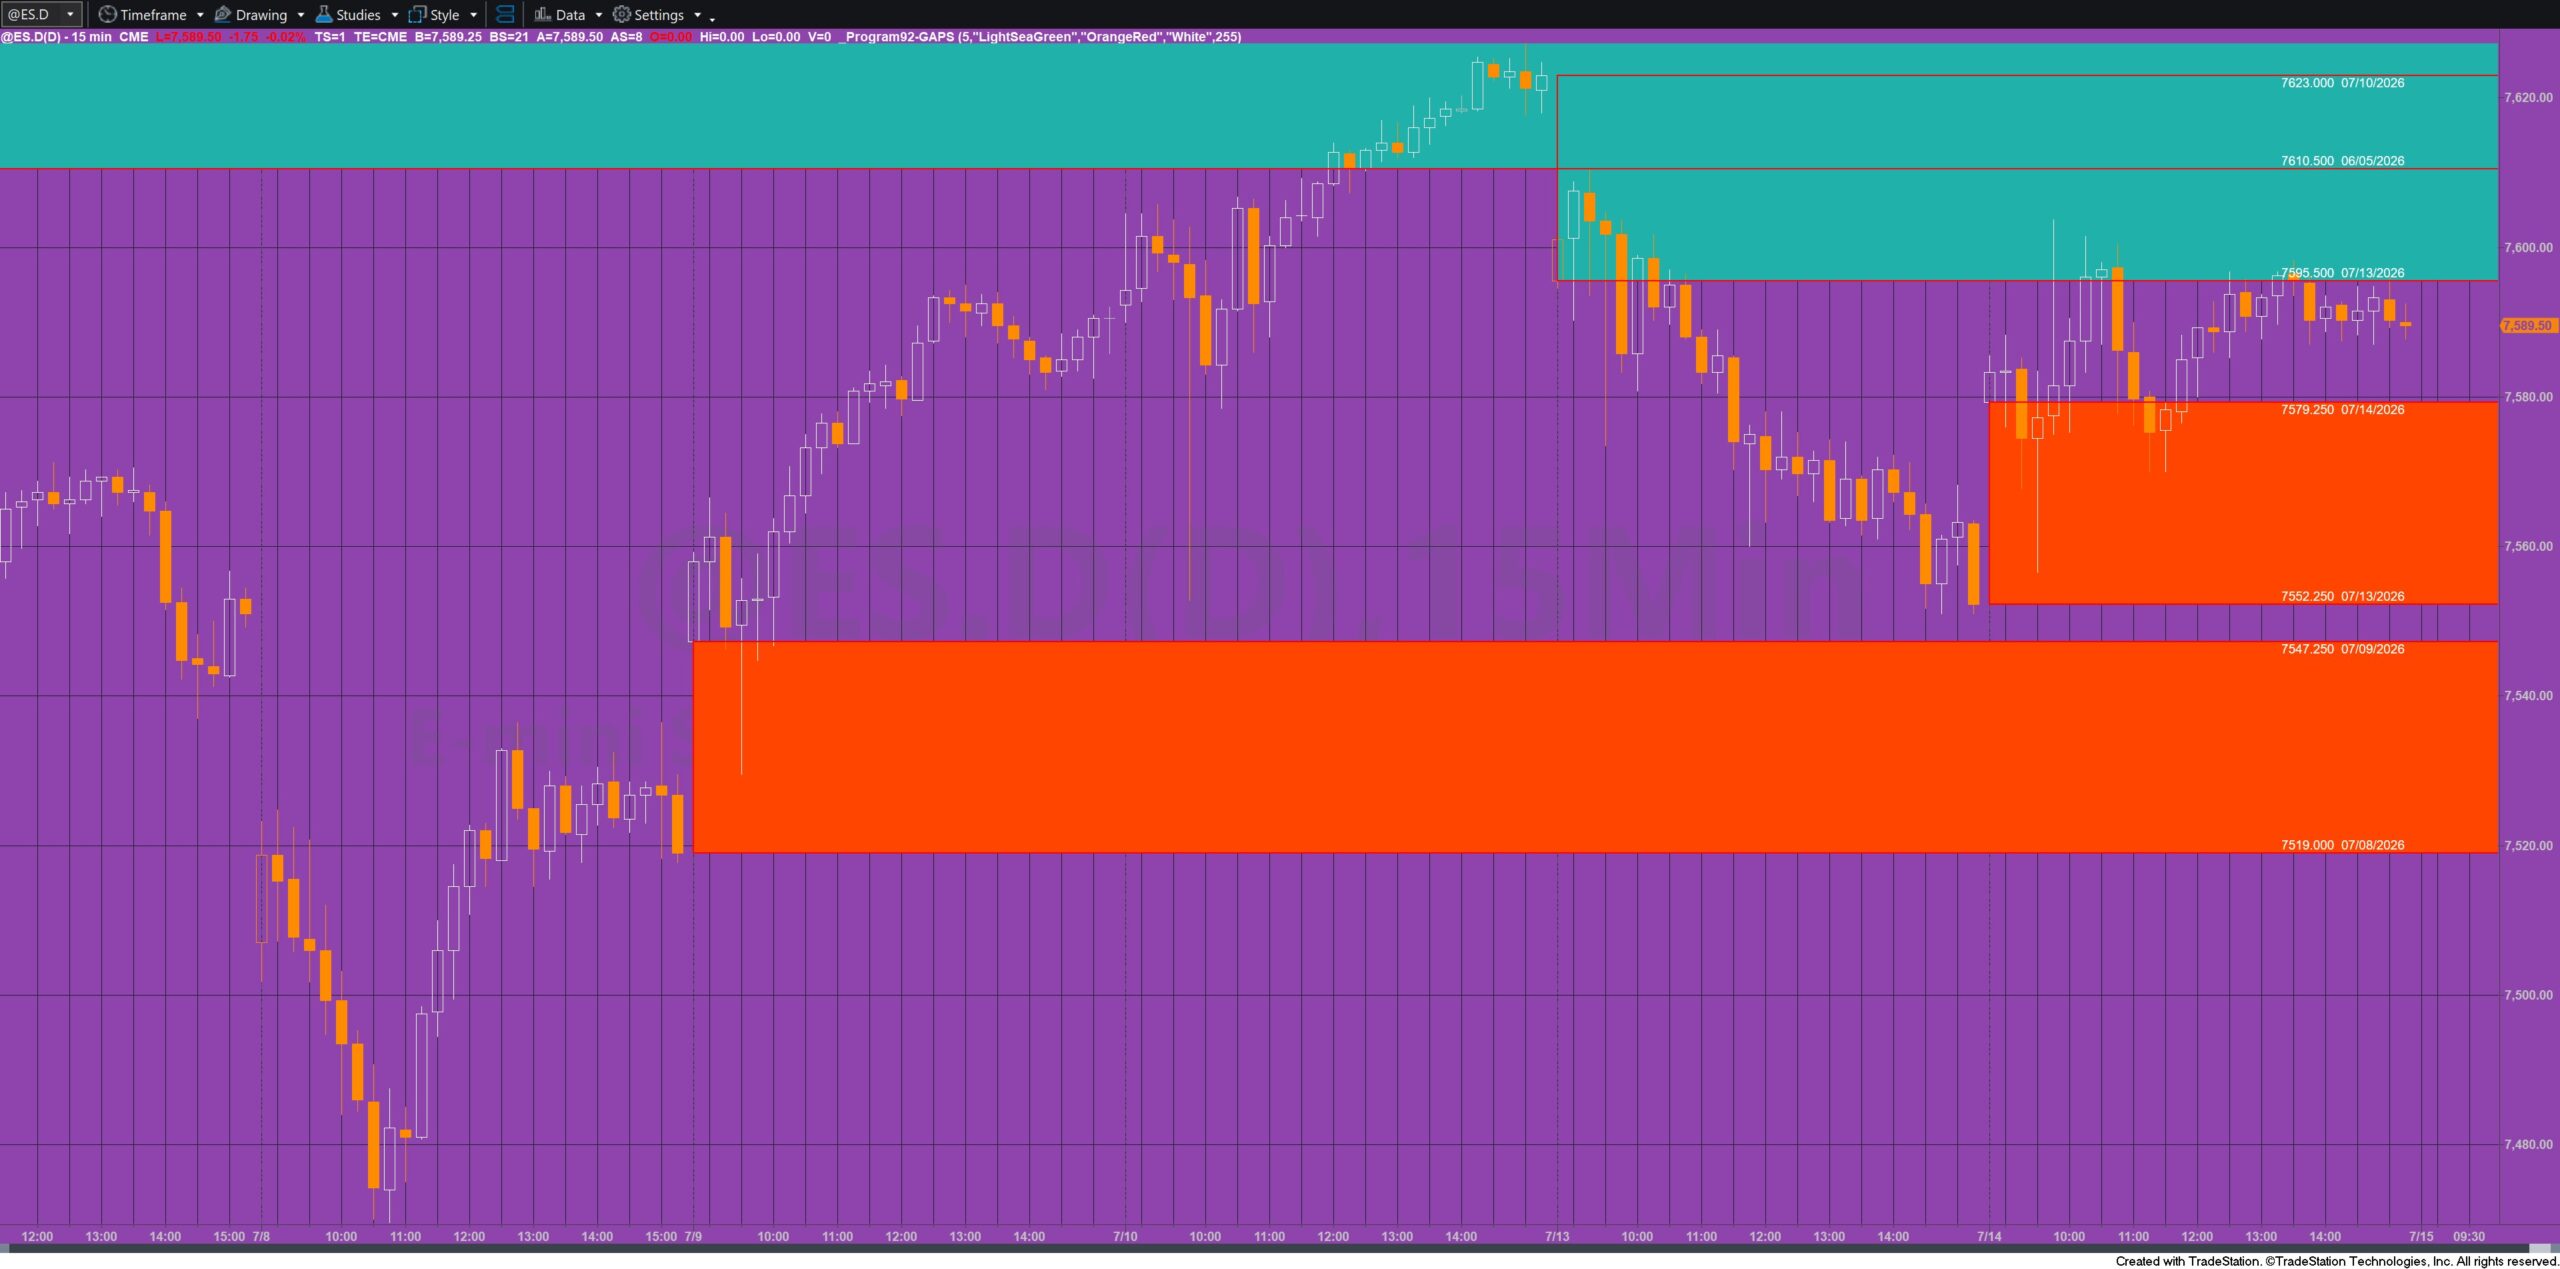
Whenever a new trading day begins, the show-me study compares today’s opening price with yesterday’s closing price. If the two prices differ, a new gap is detected and recorded. The show-me study then draws a rectangle spanning the gap, allowing traders to see its location immediately. The rectangle extends automatically to the right as new bars are plotted, visually reminding the trader that the gap remains “open.”
Two text labels are also created:
- One identifies the previous day’s closing price.
- The other identifies the current day’s opening price.
The show-me study continuously monitors market activity to determine whether the gap has been filled. For a gap-up, this occurs when price trades back down to the previous close. For a gap-down, it occurs when price rallies back to the previous close. Once a gap has been filled, all associated drawing objects are automatically removed from the chart, leaving only active, unfilled gaps visible.
To prevent chart clutter, the show-me study allows the user to specify the maximum number of active gaps that remain displayed. When this limit is exceeded, the oldest gap and its associated drawing objects are removed automatically.
The show-me study is intended primarily for intraday minute charts, where traders frequently monitor overnight gaps as potential areas of support, resistance, or price attraction.
Program 92 download
Program 92 is available for IMMEDIATE download for $24.95 by clicking the following ‘add to cart’ button.
The program is NOT compatible with MultiCharts.
The program has been thoroughly tested, however, please report any software bugs.
Why gaps matter to traders
Price gaps have fascinated traders for decades because they often represent areas where buying and selling pressure became temporarily unbalanced. Since no trading occurred within the gap itself, these price levels frequently attract attention after the market opens.
Many traders believe that gaps represent unfinished business in the market. As a result, price often revisits these areas later in the session or over subsequent trading days. This tendency is commonly referred to as a “gap fill.”
Gap analysis can be useful in several ways:
Support and Resistance
Previous gaps often become important support or resistance levels. Traders may watch these areas for reversals, breakouts, or changes in market sentiment.
Market sentiment
Large gap-ups may indicate strong bullish sentiment driven by overnight news, earnings announcements, or economic reports. Likewise, large gap-downs often reflect bearish sentiment or unexpected negative developments.
Measuring momentum
Not all gaps behave the same way. Some fill quickly, suggesting that the overnight move lacked conviction. Others remain open for weeks or months, indicating that strong momentum continues to drive prices away from the previous day’s close.
Trade planning
Intraday traders can use gap locations when planning entries, exits, and stop-loss placement. A trader expecting a gap fill may enter positions targeting the previous close, while others may treat an unfilled gap as an area likely to provide support or resistance.
Risk management
Because gaps often coincide with increased volatility, they remind traders that overnight risk can be substantial. Monitoring active gaps can help traders better understand where significant price reactions may occur.
Programming Concepts and Lessons
Although the finished show me study appears relatively straightforward, it demonstrates several useful EasyLanguage programming techniques that extend well beyond simple indicator development.
Drawing objects
Rather than relying on traditional plotting functions, the show-me study makes extensive use of TradeStation’s drawing objects, including rectangles and text labels. This provides significantly greater flexibility, allowing graphics to be created,
modified, repositioned, and deleted dynamically during program execution.
Dynamic object management
Each detected gap consists of several related objects:
- Previous close price
- Current open price
- Rectangle object
- Previous close label
- Opening price label
These are stored in synchronized Vector collections so that every object associated with a particular gap can be managed as a single logical unit. This approach greatly simplifies updating and deleting graphics as market conditions change.
Persistent data structures
Instead of tracking only the most recent gap, the program maintains a collection of active gaps. This demonstrates how dynamic collections can be used to store an unknown number of objects while allowing efficient insertion and removal as new gaps appear and old gaps are filled.
Event-driven logic
The show-me study performs different tasks depending on market events:
- Detecting the first bar of a new trading day
- Creating new drawing objects
- Monitoring every incoming bar for gap fills
- Updating drawing locations as new bars arrive
- Removing graphics when they are no longer needed
This event-driven style is common in professional trading applications and illustrates how indicators can react intelligently to changing market conditions.
Code organization
The program separates functionality into logical sections, including:
- Initialization
- Utility methods
- Gap detection
- Drawing creation
- Gap monitoring
- Object cleanup
Breaking a program into clearly defined sections improves readability, simplifies debugging, and makes future enhancements much easier.
Program 92 walkthrough
Available Colors
| AliceBlue | DarkSlateGray | LightSalmon | PaleVioletRed |
| AntiqueWhite | DarkTurquoise | LightSeaGreen | PapayaWhip |
| Aqua | DarkViolet | LightSkyBlue | PeachPuff |
| Aquamarine | DeepPink | LightSlateGray | Peru |
| Azure | DeepSkyBlue | LightSteelBlue | Pink |
| Beige | DimGray | LightYellow | Plum |
| Bisque | DodgerBlue | Lime | PowderBlue |
| Black | Firebrick | LimeGreen | Purple |
| BlanchedAlmond | FloralWhite | Linen | Red |
| Blue | ForestGreen | Magenta | RosyBrown |
| BlueViolet | Fuschia | Maroon | RoyalBlue |
| Brown | Gainsboro | MediumAquamarine | SaddleBrown |
| Burlywood | GhostWhite | MediumBlue | Salmon |
| CadetBlue | Gold | MediumOrchid | SandyBrown |
| Chartreuse | Goldenrod | MediumPurple | SeaGreen |
| Chocolate | Gray | MediumSeaGreen | Seashell |
| Coral | Green | MediumSlateBlue | Sienna |
| CornflowerBlue | GreenYellow | MediumSpringGreen | Silver |
| Cornsilk | Honeydew | MediumTurquoise | SkyBlue |
| Cyan | HotPink | MediumVioletRed | SlateBlue |
| DarkBlue | IndianRed | MidnightBlue | SlateGray |
| DarkBrown | Indigo | MintCream | Snow |
| DarkCyan | Ivory | MistyRose | SpringGreen |
| DarkGoldenrod | Khaki | Moccasin | SteelBlue |
| DarkGray | Lavender | NavajoWhite | Tan |
| DarkGreen | LavenderBlush | Navy | Teal |
| DarkKhaki | LawnGreen | OldLace | Thistle |
| Dark Magenta | LemonChiffon | Olive | Tomato |
| DarkOliveGreen | LightBlue | OliveDrab | Turquoise |
| DarkOrange | LightCoral | Orange | Violet |
| DarkOrchid | LightCyan | OrangeRed | Wheat |
| DarkRed | LightGoldenrodYellow | Orchid | White |
| DarkSalmon | LightGray | PaleGoldenrod | WhiteSmoke |
| DarkSeaGreen | LightGreen | PaleGreen | Yellow |
| DarkSlateBlue | LightPink | PaleTurquoise | YellowGreen |
TO THE BEST OF MARKPLEX CORPORATION’S KNOWLEDGE, ALL OF THE INFORMATION ON THIS PAGE IS CORRECT, AND IT IS PROVIDED IN THE HOPE THAT IT WILL BE USEFUL. HOWEVER, MARKPLEX CORPORATION ASSUMES NO LIABILITY FOR ANY DAMAGES, DIRECT OR OTHERWISE, RESULTING FROM THE USE OF THIS INFORMATION AND/OR PROGRAM(S) DESCRIBED, AND NO WARRANTY IS MADE REGARDING ITS ACCURACY OR COMPLETENESS. USE OF THIS INFORMATION AND/OR PROGRAMS DESCRIBED IS AT YOUR OWN RISK.
ANY EASYLANGUAGE OR POWERLANGUAGE TRADING STRATEGIES, SIGNALS, STUDIES, INDICATORS, SHOWME STUDIES, PAINTBAR STUDIES, PROBABILITYMAP STUDIES, ACTIVITYBAR STUDIES, FUNCTIONS (AND PARTS THEREOF) AND ASSOCIATED TECHNIQUES REFERRED TO, INCLUDED IN OR ATTACHED TO THIS TUTORIAL OR PROGRAM DESCRIPTION ARE EXAMPLES ONLY, AND HAVE BEEN INCLUDED SOLELY FOR EDUCATIONAL PURPOSES. MARKPLEX CORPORATION. DOES NOT RECOMMEND THAT YOU USE ANY SUCH TRADING STRATEGIES, SIGNALS, STUDIES, INDICATORS, SHOWME STUDIES, PAINTBAR STUDIES, PROBABILITYMAP STUDIES, ACTIVITYBAR STUDIES, FUNCTIONS (OR ANY PARTS THEREOF) OR TECHNIQUES. THE USE OF ANY SUCH TRADING STRATEGIES, SIGNALS, STUDIES, INDICATORS, SHOWME STUDIES, PAINTBAR STUDIES, PROBABILITYMAP STUDIES, ACTIVITYBAR STUDIES, FUNCTIONS AND TECHNIQUES DOES NOT GUARANTEE THAT YOU WILL MAKE PROFITS, INCREASE PROFITS, OR MINIMIZE LOSSES.