
This program is updated occasionally. See below for details of the update history.
The program works with versions 8.7 and above, including TradeStation version 9.1.
Overview
 Some technical analysts calculate ‘pivot’ levels based on the high, low, close and, sometimes, open of the new day. and believe that these levels hold special significance as support and resistance levels. Program 2 calculates these pivot levels (using the classic method of calculation, the ‘Woodie’ levels, or the ‘Camarilla’ levels) it then seeks to find pivot levels that are close to those found previously on the chart (within a specified user input tolerance) and draws these levels on the chart.
The rationale behind the program is that if pivot levels have had real significance on a previous day then some of that influence could still be felt on the current day.
This program is available for immediate download for $49.95 by clicking here to pay using PayPal or credit card:
The program works with versions 8.7 and above, including TradeStation version 9.1.
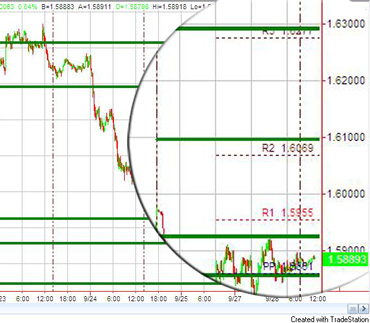
The following chart shows the program applied to a 10 minute GBPUSD chart.
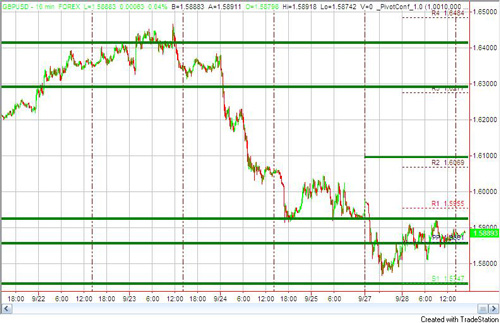
This Pivot-Confluence show-me study works on intra-day charts. Each day it calculates pivot levels and plots them on the chart. These levels are calculated using the high, and low between specific user defined times the previous day and the close at an end time. These times may be the start and end of a day or they could be just part of a day. Similarly, the ‘Woodie’ pivot uses an open time. This is set as a user input.
For 24 hour charts or others that have data that spans midnight, the program correctly uses the data in the 0000 bar as belonging to the previous day.
The program then compares these new levels with those already stored in an array. If they are within a user defined tolerance of a pre-existing line then they are combined with the existing line and the thickness parameter of that line is increased. If not, they are added to the array and the oldest lines stored in the array is deleted.
A pivot line is extended to the right if its thickness parameter is greater than an input value. The maximum thickness of a line plotted is TradeStation line thickness 4.
Please note: this program does A LOT of processing and can mean that it takes some time for the screen to upload after applying the program to a chart. In order to test it I suggest starting with a limited number of bars and starting with a small NumberPivots value and then increasing the number of bars.
The following video explains the use of the program in more detail.
Video demonstration of Daily Pivots Confluence Program
Program inputs
PivotType( 1 ), // 1 = Classic, 2 = Woodie, 3 = Camarilla
YestStartTime( 0800), // Must be greater than 0000. YestStartTime and YestEndTime assumed to be same date
YestEndTime( 1600 ), // YestStartTime and YestEndTime delineate the times between which we look for high and lows.
TodStartTime( 0800 ), // Used to determine Open price for Woodie pivots. The time entered is the end time of the bar. For example, the 08:00 bar on a 30 minute chart, actually opens just after 07:30.
NumberPivots( 200 ), // The number of Fibonacci combination lines to be included in the array (up to 500)
CombineVal( 2 ), // Numeric value above or below new Pivot line to determine whether it can be combined with an existing line
CombineCol( DarkGreen ), // Color of combined lines
LineSensitivity( 4 ), // ‘Thickness’ equal to or above this number extended to the right
DecPlaces( 2 ), // The number of decimal places displayed on today’s Pivot levels
DrawPivots( true ); // Set to TRUE to see Pivot levels for today
Pivot formulae
The pivots are calculated using the following formulae:
Classic
R4 = R3 + RANGE (same as: PP + RANGE * 3)
R3 = R2 + RANGE (same as: PP + RANGE * 2)
R2 = PP + RANGE
R1 = (2 * PP) – LOW
PP = (HIGH + LOW + CLOSE) / 3
S1 = (2 * PP) – HIGH
S2 = PP – RANGE
S3 = S2 – RANGE (same as: PP – RANGE * 2)
S4 = S3 – RANGE (same as: PP – RANGE * 3)
Woodie
R4 = R3 + RANGE
R3 = H + 2 * (PP – L) (same as: R1 + RANGE)
R2 = PP + RANGE
R1 = (2 * PP) – LOW
PP = PP = (HIGH + LOW + OPEN + OPEN) / 4
S1 = (2 * PP) – HIGH
S2 = PP – RANGE
S3 = L – 2 * (H – PP) (same as: S1 – RANGE)
S4 = S3 – RANGE
using OPEN = TODAY’S OPEN, and yesterday’s HIGH and LOW
Camarilla
R4 = C + RANGE * 1.1/2
R3 = C + RANGE * 1.1/4
R2 = C + RANGE * 1.1/6
R1 = C + RANGE * 1.1/12
PP = (HIGH + LOW + CLOSE) / 3
S1 = C – RANGE * 1.1/12
S2 = C – RANGE * 1.1/6
S3 = C – RANGE * 1.1/4
S4 = C – RANGE * 1.1/2
Using the program
Program 2 designed for intraday charts, is similar to program 1 and tutorial 13.
Every time a new pivot line is found the program goes though all the pivot lines that are currently stored in an array. An array is a data structure that stores multiple values. If the program finds a new pivot line and the new line is within a band that is bounded by an existing pivot stored in the array plus or minus the CombineVal then the program increases the thickness of the line stored in the array (provided the existing thickness of the line is 3 or less). If a new pivot is NOT within the CombineVal tolerance of a line already in the array then the program deletes the oldest pivot line in the array and stores the new line. Therefore by increasing the CombineVal input means that more new pivots that the program finds with be within tolerance of existing pivots lines and they will be combined and become thicker. Hence a really small value of CombineVal would mean that virtually no lines would ever combine. The Combineval you use for a specific symbol will vary from symbol to symbol.
If you were to apply the program to a GBPUSD chart and set the CombineVal to 0.0001 then you would see very few lines being combined because for them to combine they would have to be within 0.0001. A very large CombineVal would mean that lots of lines would combine (and they may even have combined off the screen where you cannot see them).
In terms of thickness, EasyLanguage uses a programming construct (TL_SetSize) that can set line thickness at either 0 (very thin), 1 (thin), 2, 3 (thick). The LineSensitivity input setting determines when a line is extended to the right. Possible values are 0, 1, 2, 3, 4 and up. If LineSensitivity is set to 4 then only lines with a thickness of 4 or greater are extended to the right. If it is set to 0 then all lines that are combined are extended to the right. Note that even though the maximum thickness that a line can be plotted is 3, the thickness stored in the array is not limited. It is this value that LineSensitivity is compared against.
This program is available for immediate download for $49.95 by clicking here to pay using PayPal or credit card:
The program works with versions 8.7 and above, including TradeStation version 9.1.
The program is ‘unprotected,’ in other words, you will be able to see the program. If you would prefer to pay be check, please make a check payable to Billy Fire LLC and mail to 14781 Pomerado Road, #110, Poway CA 92064 together with a valid email address. I will email download instructions to you.
I have included extensive comments in the code to help you understand how it works..
Please email any bugs that you discover to support@markplex.com.
This program is available for immediate download for $49.95 by clicking here to pay using PayPal or credit card:
The program works with versions 8.7 and above, including TradeStation version 9.1.
The program is ‘unprotected,’ in other words, you will be able to see the program.
I have included extensive comments in the code to help you understand how it works.
*** Update History | New Versions ***
October 15, 2009 | _PivotConf_1.1
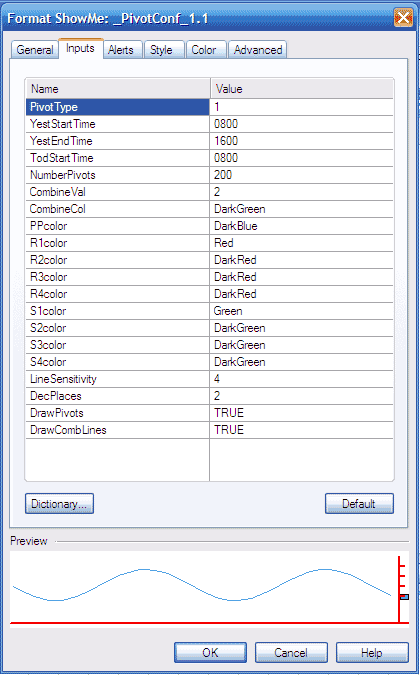
Version 1.1 allows the user to change the colors of the pivot, resistance and support levels. It also ensures that the values of these pivot levels appear on the chart on the current bar.
The following image shows the inputs for pivot colors:
October 19, Version _PivotConf_1.2
Minor changes to comments and change to make sure that the text displaying today’s pivot levels are only moved on the last tick of the bar.
This program is available for immediate download for $49.95 by clicking here to pay using PayPal or credit card:
The program works with versions 8.7 and above, including TradeStation version 9.1.
TO THE BEST OF MARKPLEX CORPORATION’S KNOWLEDGE, ALL OF THE INFORMATION ON THIS PAGE IS CORRECT, AND IT IS PROVIDED IN THE HOPE THAT IT WILL BE USEFUL. HOWEVER, MARKPLEX CORPORATION ASSUMES NO LIABILITY FOR ANY DAMAGES, DIRECT OR OTHERWISE, RESULTING FROM THE USE OF THIS INFORMATION AND/OR PROGRAM(S) DESCRIBED, AND NO WARRANTY IS MADE REGARDING ITS ACCURACY OR COMPLETENESS. USE OF THIS INFORMATION AND/OR PROGRAMS DESCRIBED IS AT YOUR OWN RISK.
ANY EASYLANGUAGE OR POWERLANGUAGE TRADING STRATEGIES, SIGNALS, STUDIES, INDICATORS, SHOWME STUDIES, PAINTBAR STUDIES, PROBABILITYMAP STUDIES, ACTIVITYBAR STUDIES, FUNCTIONS (AND PARTS THEREOF) AND ASSOCIATED TECHNIQUES REFERRED TO, INCLUDED IN OR ATTACHED TO THIS TUTORIAL OR PROGRAM DESCRIPTION ARE EXAMPLES ONLY, AND HAVE BEEN INCLUDED SOLELY FOR EDUCATIONAL PURPOSES. MARKPLEX CORPORATION. DOES NOT RECOMMEND THAT YOU USE ANY SUCH TRADING STRATEGIES, SIGNALS, STUDIES, INDICATORS, SHOWME STUDIES, PAINTBAR STUDIES, PROBABILITYMAP STUDIES, ACTIVITYBAR STUDIES, FUNCTIONS (OR ANY PARTS THEREOF) OR TECHNIQUES. THE USE OF ANY SUCH TRADING STRATEGIES, SIGNALS, STUDIES, INDICATORS, SHOWME STUDIES, PAINTBAR STUDIES, PROBABILITYMAP STUDIES, ACTIVITYBAR STUDIES, FUNCTIONS AND TECHNIQUES DOES NOT GUARANTEE THAT YOU WILL MAKE PROFITS, INCREASE PROFITS, OR MINIMIZE LOSSES.