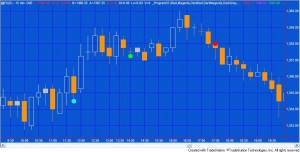
Program 32 is a TradeStation EasyLanguage ShowMe study developed in version 9.0. It stores that times at which the high of the day and the low of the day occurred. When each new day begins the program calculates at which times the highs and lows of the days have occurred most frequently. It then gives the user the option of plotting up to the top 5 of these times. Tops are plotted at the high of the bar and bottoms are plotted at the low of the bar.
The program makes extensive use of vectors to store high/low and time data.
You may be interested in this program for the following reasons:
1) You are interested in studying the behavior of daily highs and lows and whether there is any correlation between future highs and lows and historical highs
lows.
2) You would like to learn to use vectors and to see some examples of how to ‘cast’ the data type.
3) You would like to see one method of sorting vectors
4) You are interested in creating methods
The user inputs:
HiFreqTops( 5 ),
and HiFreqBottoms( 5 )
control how many of the tops and bottoms are plotted on the chart. So, for example, if HiFreqTops is set to two then the most frequent and the second most
frequent times when the high of the day occurred are plotted.
The colors of these dots are controlled by the following inputs:
TopColor1( Red ),
TopColor2( Magenta ),
TopColor3( DarkRed ),
TopColor4( DarkMagenta ),
TopColor5( DarkGray ),
BottomColor1( Green ),
BottomColor2( Cyan ),
BottomColor3( DarkGreen ),
BottomColor4( DarkCyan ),
BottomColor5( Yellow ),
HiFreqTops( 5 ),
HiFreqBottoms( 5 )
So, for example, if HiFreqBottoms were set to three, the most frequent bottoms would be shown by a green dot, the next most frequent by a cyan dot and the third most recent by a DarkGreen dot.
This UNPROTECTED program (i.e. the TradeStation EasyLanguage showme study) DEVELOPED IN VERSION 9.0 is available for immediate download for $34.95 by clicking the ‘add to cart’ button to pay using Credit card or PayPal. Gold Pass members are eligible for 20% off this price.
Video explanation of program 32
This UNPROTECTED program (i.e. the TradeStation EasyLanguage showme study) DEVELOPED IN VERSION 9.0 is available for immediate download for $34.95 by clicking the ‘add to cart’ button to pay using Credit card or PayPal. Gold Pass members are eligible for 20% off this price.
TO THE BEST OF MARKPLEX CORPORATION’S KNOWLEDGE, ALL OF THE INFORMATION ON THIS PAGE IS CORRECT, AND IT IS PROVIDED IN THE HOPE THAT IT WILL BE USEFUL. HOWEVER, MARKPLEX CORPORATION ASSUMES NO LIABILITY FOR ANY DAMAGES, DIRECT OR OTHERWISE, RESULTING FROM THE USE OF THIS INFORMATION AND/OR PROGRAM(S) DESCRIBED, AND NO WARRANTY IS MADE REGARDING ITS ACCURACY OR COMPLETENESS. USE OF THIS INFORMATION AND/OR PROGRAMS DESCRIBED IS AT YOUR OWN RISK.
ANY EASYLANGUAGE OR POWERLANGUAGE TRADING STRATEGIES, SIGNALS, STUDIES, INDICATORS, SHOWME STUDIES, PAINTBAR STUDIES, PROBABILITYMAP STUDIES, ACTIVITYBAR STUDIES, FUNCTIONS (AND PARTS THEREOF) AND ASSOCIATED TECHNIQUES REFERRED TO, INCLUDED IN OR ATTACHED TO THIS TUTORIAL OR PROGRAM DESCRIPTION ARE EXAMPLES ONLY, AND HAVE BEEN INCLUDED SOLELY FOR EDUCATIONAL PURPOSES. MARKPLEX CORPORATION. DOES NOT RECOMMEND THAT YOU USE ANY SUCH TRADING STRATEGIES, SIGNALS, STUDIES, INDICATORS, SHOWME STUDIES, PAINTBAR STUDIES, PROBABILITYMAP STUDIES, ACTIVITYBAR STUDIES, FUNCTIONS (OR ANY PARTS THEREOF) OR TECHNIQUES. THE USE OF ANY SUCH TRADING STRATEGIES, SIGNALS, STUDIES, INDICATORS, SHOWME STUDIES, PAINTBAR STUDIES, PROBABILITYMAP STUDIES, ACTIVITYBAR STUDIES, FUNCTIONS AND TECHNIQUES DOES NOT GUARANTEE THAT YOU WILL MAKE PROFITS, INCREASE PROFITS, OR MINIMIZE LOSSES.

