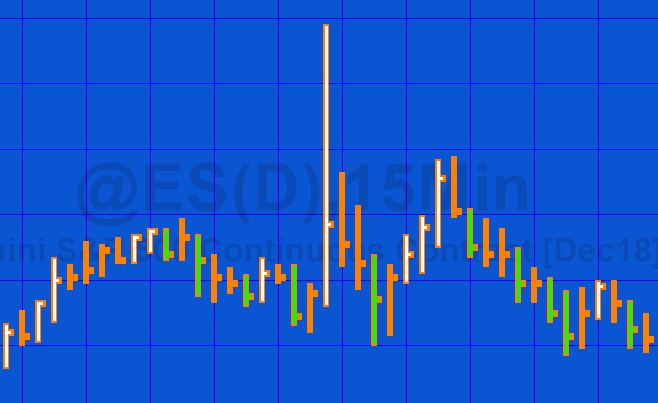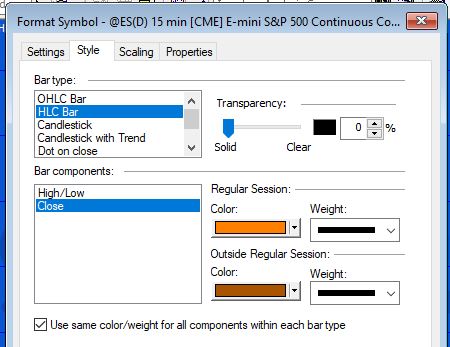
Quick-tip 27 demonstrates how to use a paint bar study with an HLC chart to color bars. If a bar that closes higher than the previous bar it is colored white and if a bar closes lower than the previous bar it is colored green.
As the last bar on the chart develops, the paint bars will be plotted based on the current value of the close. So, for example, the close (the price of the last tick) might initially be higher than the high of the previous bar but subsequently go below that level.
{ THIS PAINT BAR STUDY IS PROVIDED IN THE HOPE THAT IT WILL BE USEFUL. HOWEVER, MARKPLEX CORPORATION ASSUMES NO LIABILITY FOR ANY DAMAGES, DIRECT OR OTHERWISE,
RESULTING FROM THE USE OF THIS INFORMATION, AND NO WARRANTY IS MADE REGARDING ITS ACCURACY OR COMPLETENESS. USE OF THIS INFORMATION IS AT YOUR OWN RISK.
THIS STRATEGY AND ASSOCIATED TECHNIQUES IS AN EXAMPLE ONLY, AND HAS BEEN INCLUDED SOLELY FOR EDUCATIONAL PURPOSES. MARKPLEX CORPORATION DOES NOT RECOMMEND
THAT YOU USE ANY SUCH TRADING STRATEGIES, INDICATORS, SHOWME STUDIES, PAINTBAR STUDIES, PROBABILITYMAP STUDIES, ACTIVITYBAR STUDIES, FUNCTIONS
(OR ANY PARTS THEREOF) OR TECHNIQUES. THE USE OF THIS PAINT BAR STUDY DOES NOT GUARANTEE THAT YOU WILL MAKE PROFITS, INCREASE PROFITS, OR MINIMIZE LOSSES. }

// If Close of this bar is greater than the high of the previous bar
// Color bar white
If C > H[1] then
Begin
Plot1( H, "h1", White, Default, 2 );
Plot2( L, "h2", White, Default, 3 );
Plot3( O, "h3", Transparent, Default, 2 );
Plot4( C, "h4", White, Default, 2 );
End;

// If Close of this bar is less than the low of the previous bar
// Color bar green
If C < L[1] then
Begin
Plot1( H, "h1", Green, Default, 2 );
Plot2( L, "h2", Green, Default, 2 );
Plot3( O, "h3", Transparent, Default, 2 );
Plot4( C, "h4", Green, Default, 2 );
End;

{ ** Copyright (c) 2018 Markplex Corporation. All rights reserved. **
** Markplex Corporation reserves the right to modify or overwrite this analysis technique
on its https://markplex.com Web site. ** }
Since we are using HLC bars, notice that plot3, the open plot, is colored transparent so that it does not appear on the plot.