

Volume criteria show me study
A video to demonstrate a ShowMe study that plots when volume > x where x is a user input, and count the number of times it occurs.
Question
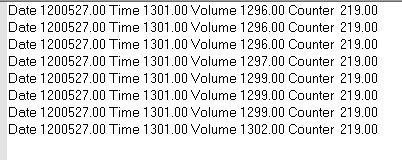
The volumes plotted don’t appear to be the numbers I expected. What is going on? I have the program applied to a 5 minute @ES chart.
Answer
The problem is probably arising because the keyword ‘volume’ has many different meanings in TradeStation depending on what sort of chart you are using (and whether you have ‘for volume’ set to trade volume or tick count in the symbol settings).
If you open the program in the TDE (TradeStation Development Environment) and right click the keyword ‘volume’, and select ‘definition of volume’ you will see a link to “EasyLanguage Reserved Words Related to Ticks, Volume & Open Interest.”
If you are using @ES/5 min refer to the information about futures symbols you will see that the keyword, volume, actually refers to the volume traded on upticks. If you want total volume then you should replace the word ‘volume‘ with ‘ticks.’