Quick-tip 42 is a TradeStation show-me study to find the lowest daily low for a period between user inputs Daysback1 + 1 and Daysback1 + Daysback2 days ago. This is stored in a variable: LowPeriod2. The lowest daily low for a period between yesterday and Daysback1 days ago is also found and this is stored in variable: LowPeriod1.
If LowPeriod1 is greater than LowPeriod2, the program detects if price goes below LowPeriod2 for the current day.
It is easier to understand by looking at the following chart:
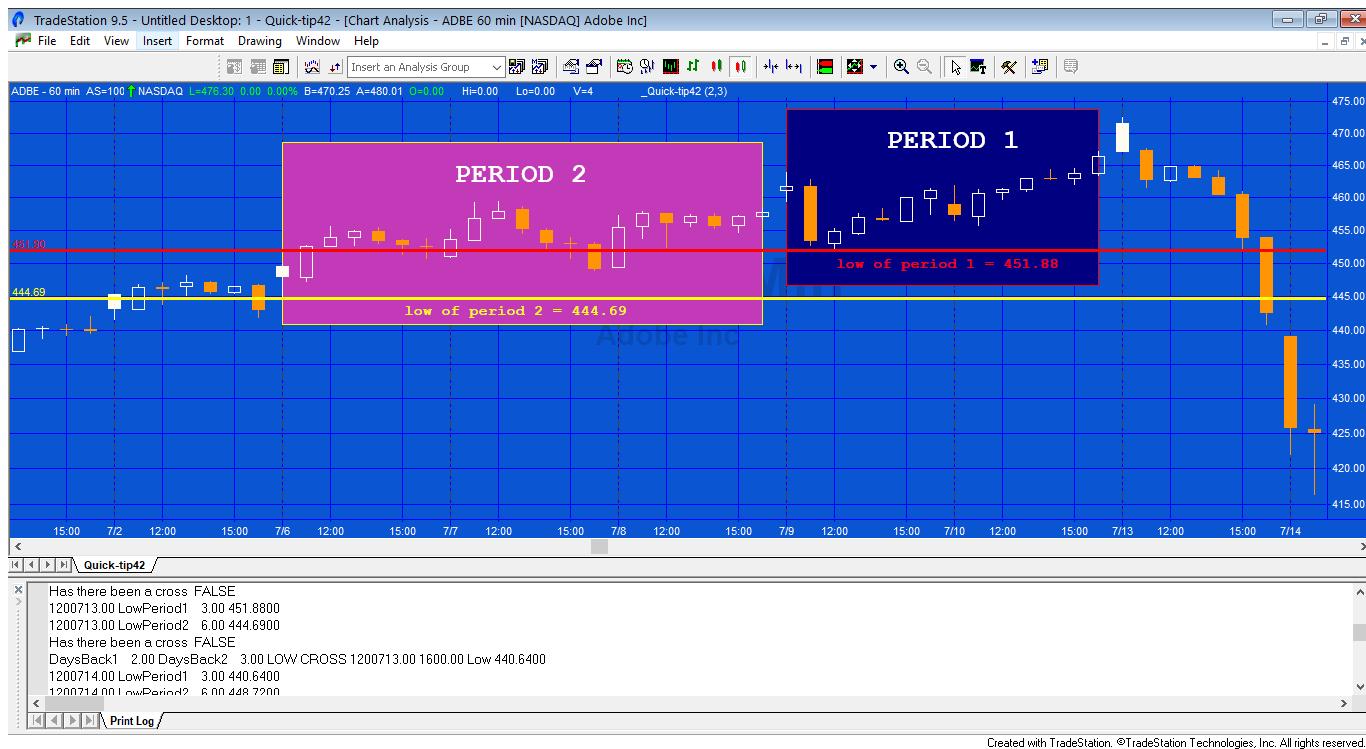
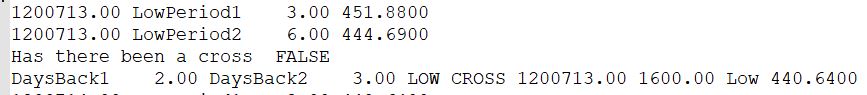
In this example Daysback1 is set to 2 and Daysback2 is set to 3. Period 1 (encompassing 2 DAYS) is shown in a blue box. Period 2 (encompassing 3 days that occurred before Period 1) is shown in the magenta box. The lowest low during Period 1 is highlighted by the red line and the lowest low during Period 2 is highlighted by the yellow line. Since the red line is higher than the yellow line the program looks for a cross of the yellow line during the day following Period 1. This occurs during the 1600 bar, as shown in the print log.
The boxes, lines and text were drawn manually using the drawing tool.