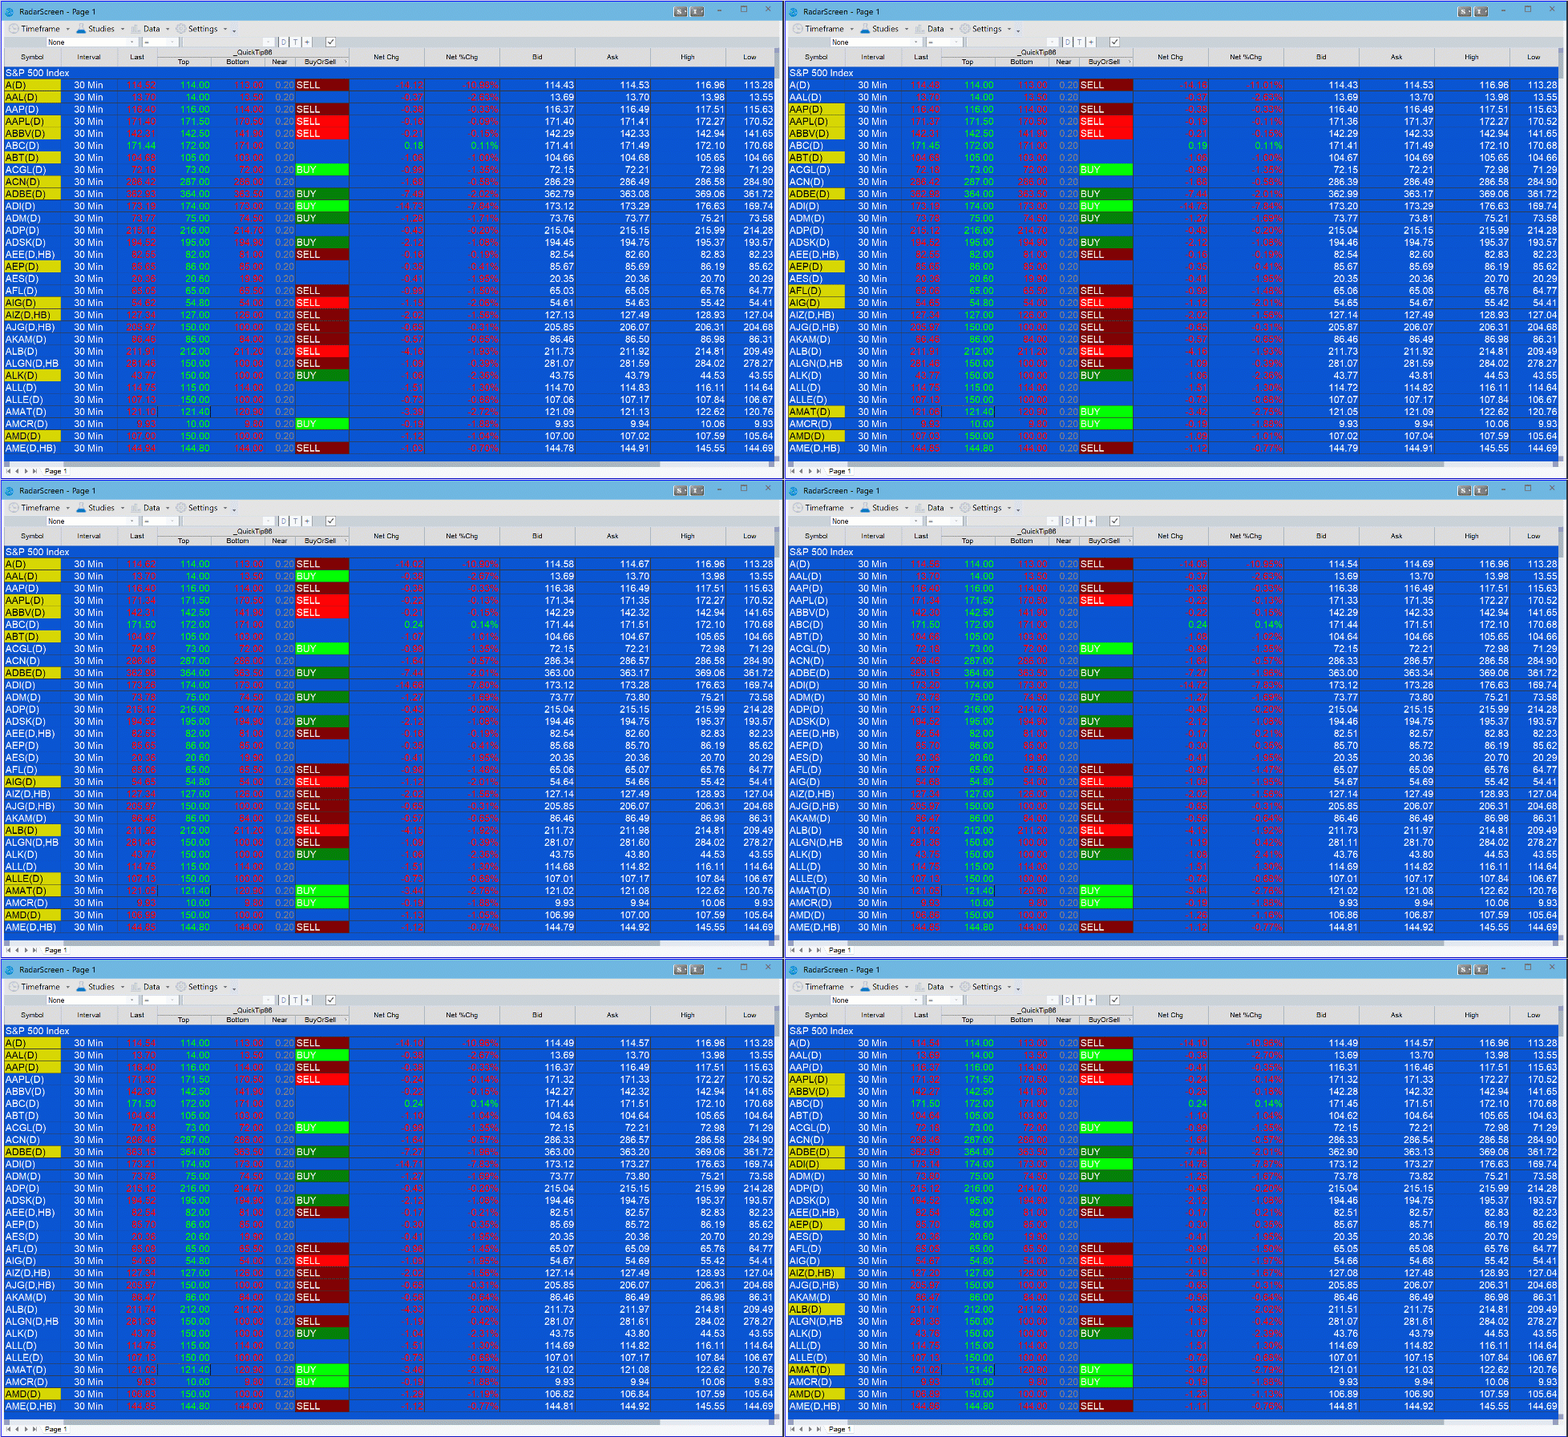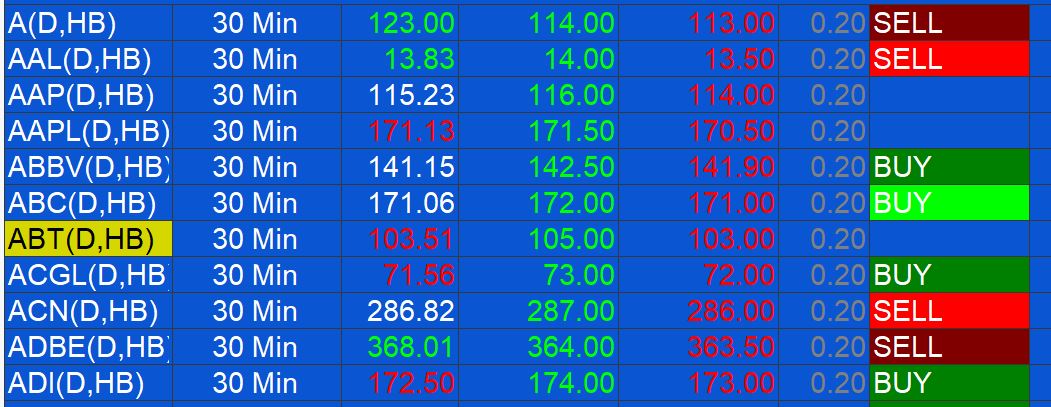
Quick-tip 86 demonstrates a simple indicator for TradeStation Radarscreen that has 3 columns: 3 input columns and one column that displays “buy” or “sell” depending on the price of the last trade.
The user inputs a “top” price, a “bottom” price and an adjustment amount (input: Near).
Inputs Columns
TOP – An upper price entered as an input. (Normally this would be price above the current price)
BOTTOM – A lower price entered as an input. (Normally this would be price below the current price)
Near – the value of the user input Near for a specific row
SIGNAL Column
The Condition will be based on the LAST price.
If the last price is above the user input Top price the signal column will plot “SELL” in dark red. If the last price is above the Top price minus the Near value, the signal column will plot “SELL” in the user input color: SigBackSell (by default, Red).
If the last price is below the user input Bottom price the signal column will plot “BUY” in dark green. If the last price is below the user input Bottom price minus the user input Near, the signal column will plot “BUY” in the user input color: SigBackBuy (by default, Green).
Condition (Cell background color)
DARKRED – “Sell” – Price above TOP
SigBackSell (by default, Red) – “Sell” – Price is Near the TOP
SigBackBuy (by default, Green) – “Buy” Price is Near the BOTTOM
DARKGREEN – “Buy” Price below BOTTOM
User inputs
Input:	         double Top( 0 ),
			double Bottom( 0 ),
			double Near( 0.20 ),

			int SigBackBuy ( Green ),
			int SigBackSell( Red );

Quick-tip 86 video
TO THE BEST OF MARKPLEX CORPORATION’S KNOWLEDGE, ALL OF THE INFORMATION ON THIS PAGE IS CORRECT, AND IT IS PROVIDED IN THE HOPE THAT IT WILL BE USEFUL. HOWEVER, MARKPLEX CORPORATION ASSUMES NO LIABILITY FOR ANY DAMAGES, DIRECT OR OTHERWISE, RESULTING FROM THE USE OF THIS INFORMATION AND/OR PROGRAM(S) DESCRIBED, AND NO WARRANTY IS MADE REGARDING ITS ACCURACY OR COMPLETENESS. USE OF THIS INFORMATION AND/OR PROGRAMS DESCRIBED IS AT YOUR OWN RISK.
ANY EASYLANGUAGE OR POWERLANGUAGE TRADING STRATEGIES, SIGNALS, STUDIES, INDICATORS, SHOWME STUDIES, PAINTBAR STUDIES, PROBABILITYMAP STUDIES, ACTIVITYBAR STUDIES, FUNCTIONS (AND PARTS THEREOF) AND ASSOCIATED TECHNIQUES REFERRED TO, INCLUDED IN OR ATTACHED TO THIS TUTORIAL OR PROGRAM DESCRIPTION ARE EXAMPLES ONLY, AND HAVE BEEN INCLUDED SOLELY FOR EDUCATIONAL PURPOSES. MARKPLEX CORPORATION. DOES NOT RECOMMEND THAT YOU USE ANY SUCH TRADING STRATEGIES, SIGNALS, STUDIES, INDICATORS, SHOWME STUDIES, PAINTBAR STUDIES, PROBABILITYMAP STUDIES, ACTIVITYBAR STUDIES, FUNCTIONS (OR ANY PARTS THEREOF) OR TECHNIQUES. THE USE OF ANY SUCH TRADING STRATEGIES, SIGNALS, STUDIES, INDICATORS, SHOWME STUDIES, PAINTBAR STUDIES, PROBABILITYMAP STUDIES, ACTIVITYBAR STUDIES, FUNCTIONS AND TECHNIQUES DOES NOT GUARANTEE THAT YOU WILL MAKE PROFITS, INCREASE PROFITS, OR MINIMIZE LOSSES.

