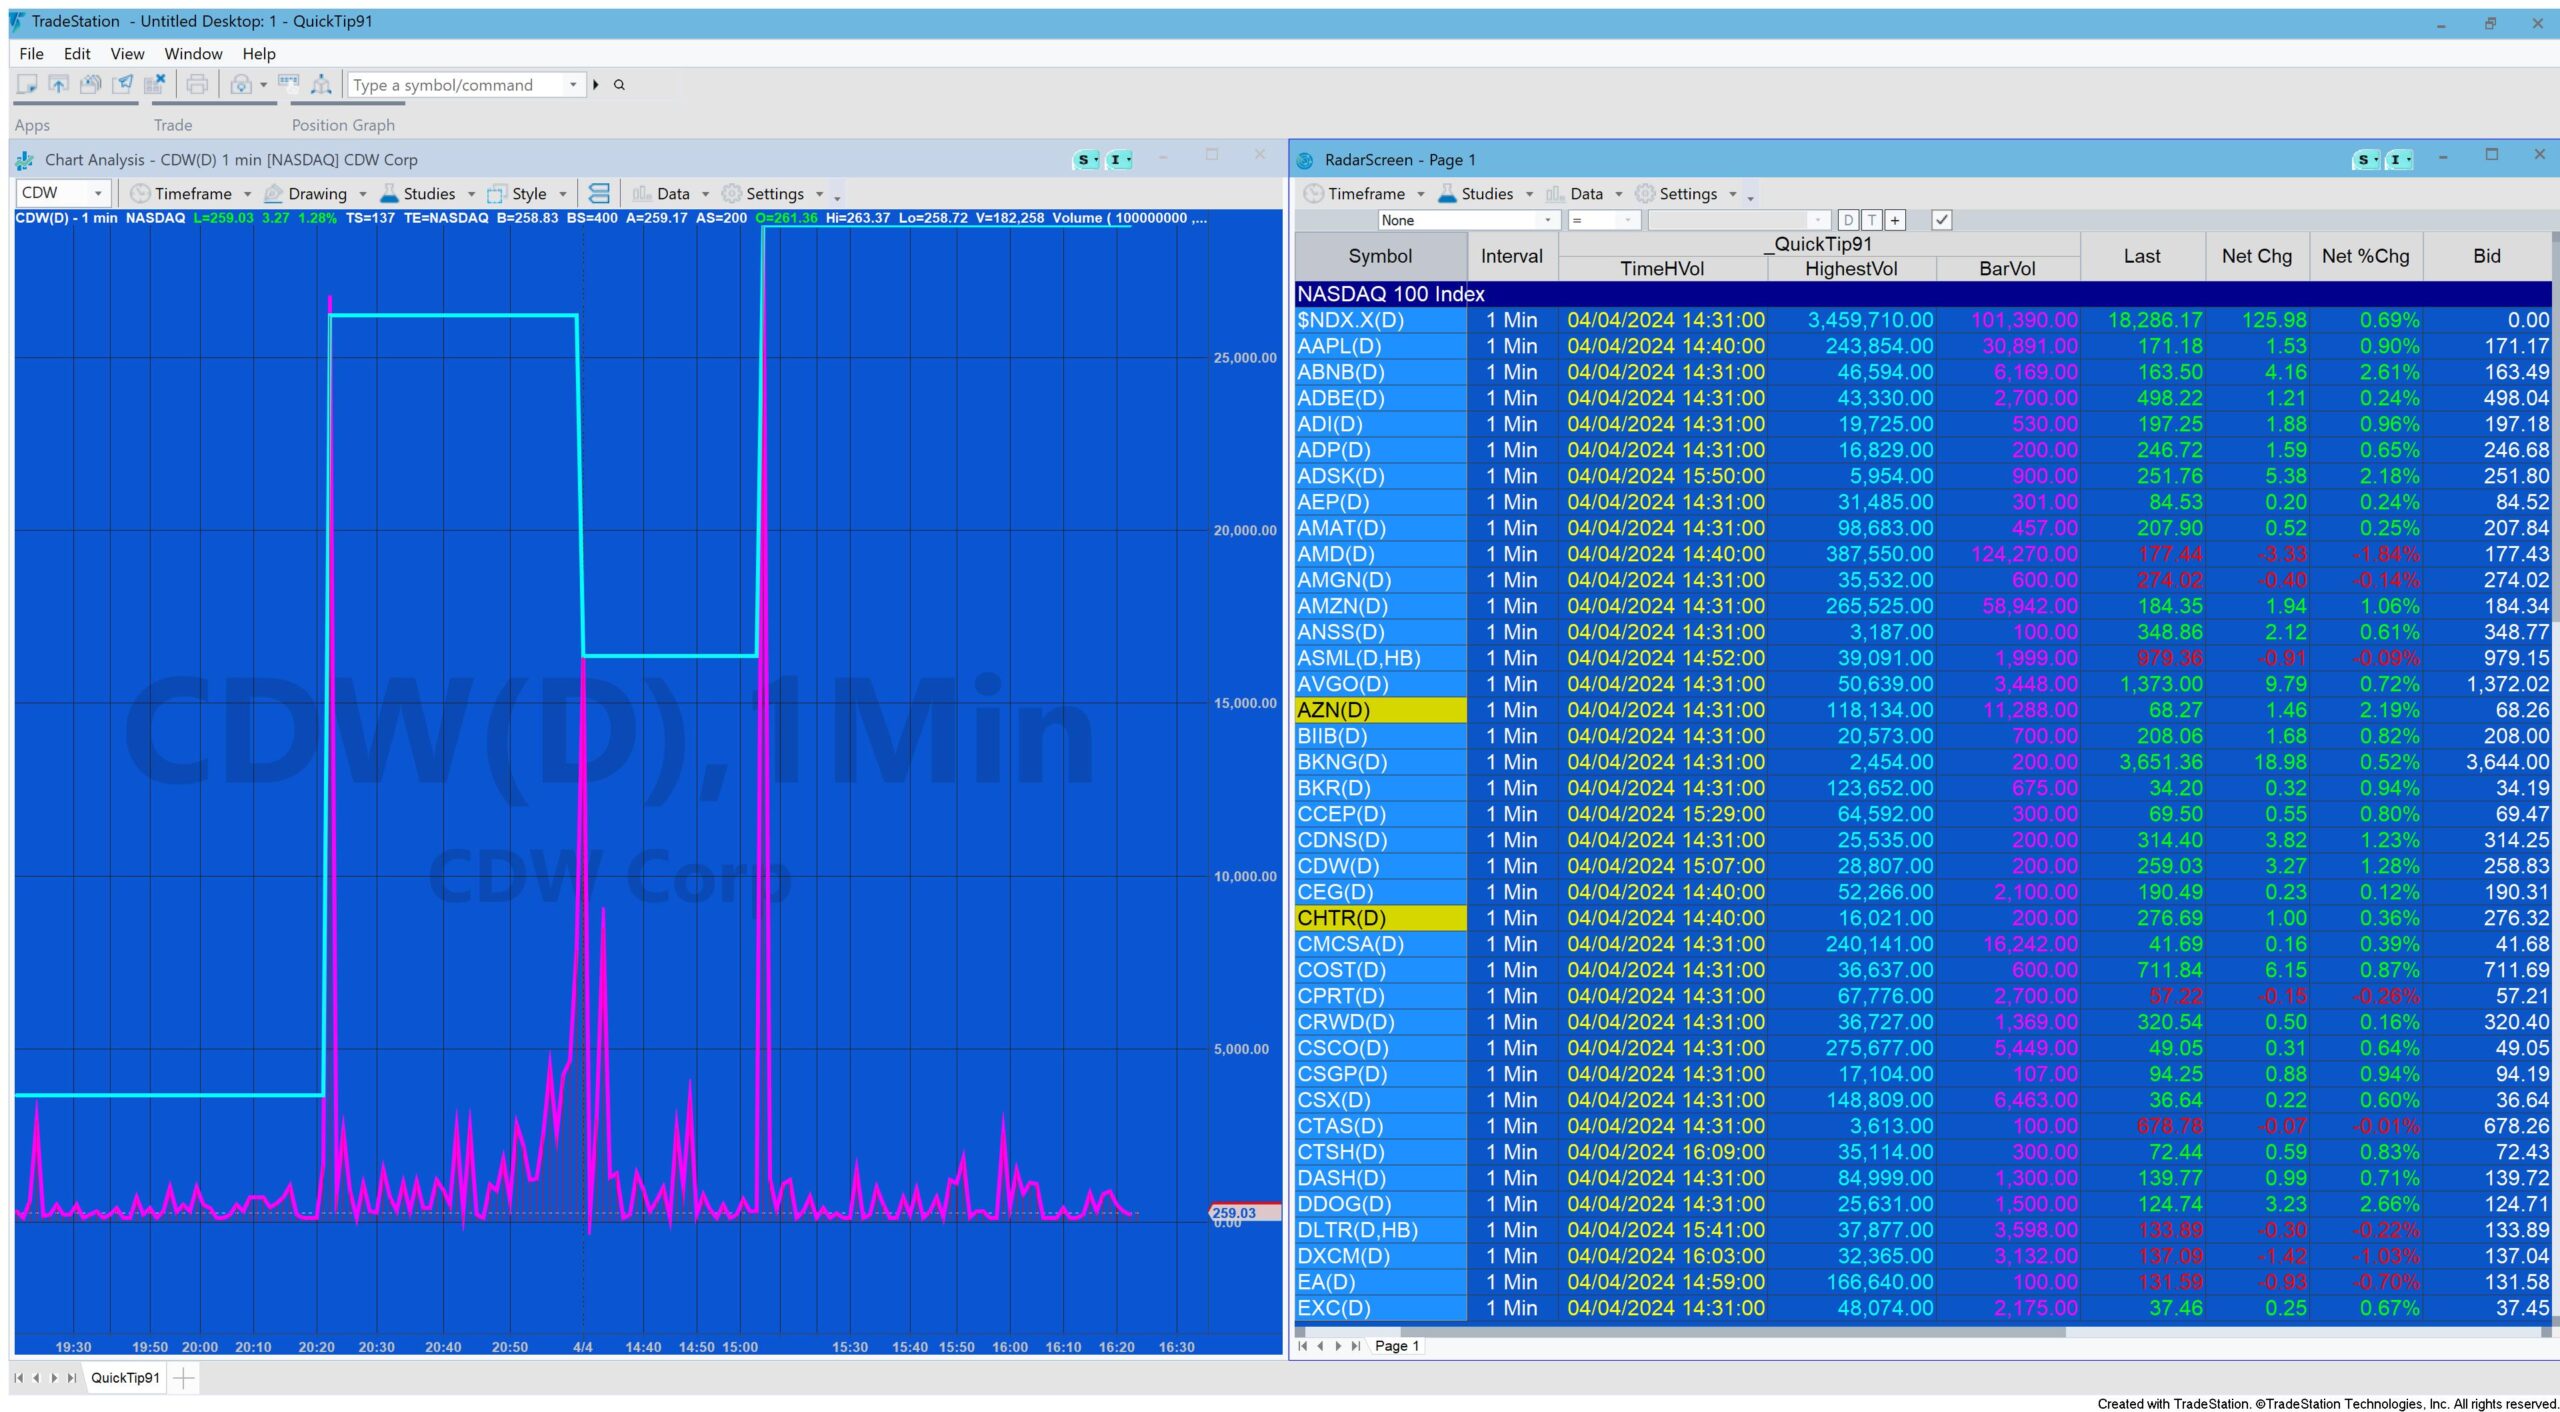
Quick-tip 91 explains a simple program for RadarScreen that displays the time when the highest volume for the day occured. The quick-tip also explains the meaning of MaxBarsBack and Load Additional Bars for Accumulative Calculations as they apply to RadarScreen. Even though the program is very simple, without the correct settings it will not function as intended.
MaxBarsBack and Load Additional Bars
The MaxBarsBack setting tells TradeStation how many bars to have available before it starts processing. So, for example, if using a chart and MaxBarsBack was set to 20, the program would jump over the first 20 bars and then start processing the program on the 21st bar. The reason for its use is if you had a program that referenced a value 20 bars ago (e.g High[20] or Close[20]) then you would need those 20 bars in order to reference the value 20 bars ago from the last bar on the chart. In this example, if the same program were added to a chart and plotted something each bar, it would be noticeable that there would be no plots for the first 20 bars.
In the same way in RadarScreen MaxBarsBack loads a number of historical bars in addition to the current bar. This data is available for back referencing but the program only runs on the latest bar. So, contunuing the above example, the program would run on the latest bar, but could access data from any of the last 20 bars.
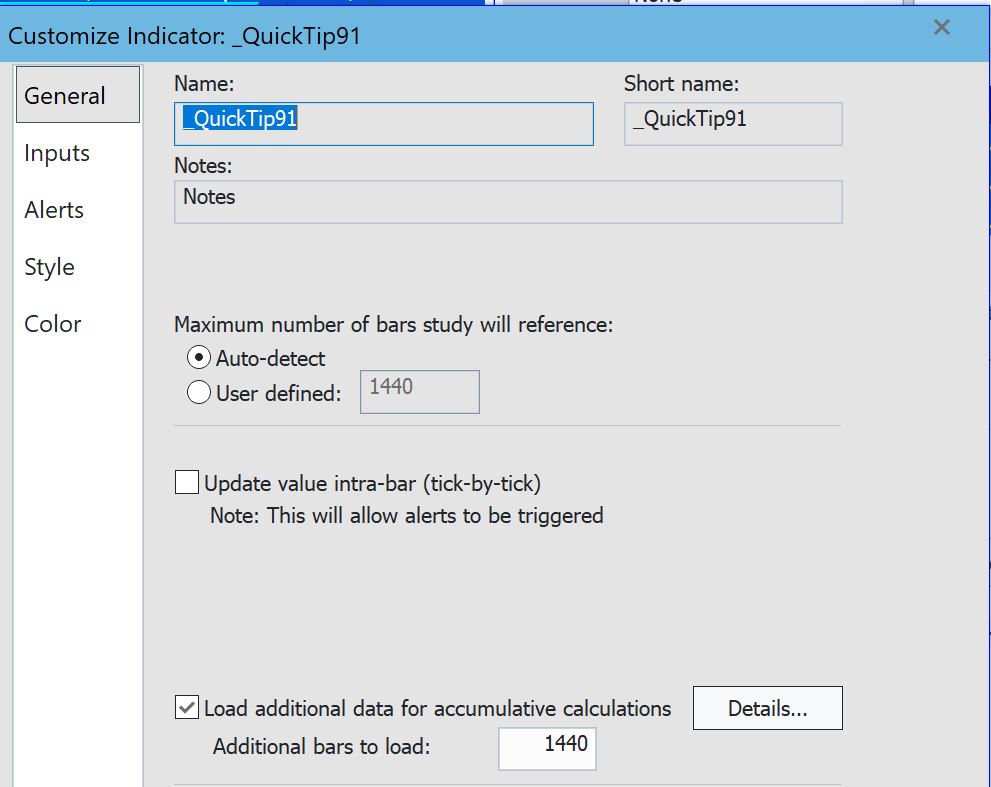
In RadarScreen, ‘Load additional data for accumulative calculations‘ setting, loads a number of additional bars, before the current bar. The major difference with this setting and MaxBarsBack is that RadarScreen doesn’t skip over these bars, rather it executes on each bar specified by the load additional setting.
Using Load additional data for accumulative calculations is essential for functions such as RSI or exponential moving average. See the following Markplex resources:
Quick-tip 5 | My indicator works fine on a chart but not on RadarScreen
Tutorial 25 – Understanding ‘smoothed’ indicators and ‘load additional bars’
It is also necessary to set Load additional data for accumulative calculations for this program. The setting needs to be equal or greater that the number of bars in the day. The example used in the video uses a 1 minute interval, hence the value is set to 1440 (i.e. 24 x 60 = 1440), i.e. the number of minutes in 24 hours.
Quick-tip 91 code
{ THIS SHOW ME STUDY IS PROVIDED IN THE HOPE THAT IT WILL BE USEFUL. HOWEVER, MARKPLEX CORPORATION ASSUMES NO LIABILITY
FOR ANY DAMAGES, DIRECT OR OTHERWISE, RESULTING FROM THE USE OF THIS INFORMATION, AND NO WARRANTY IS MADE REGARDING
ITS ACCURACY OR COMPLETENESS. USE OF THIS INFORMATION IS AT YOUR OWN RISK. THIS SHOW ME STUDY AND ASSOCIATED TECHNIQUES
IS AN EXAMPLE ONLY, AND HAS BEEN INCLUDED SOLELY FOR EDUCATIONAL PURPOSES. MARKPLEX CORPORATION DOES NOT RECOMMEND THAT
YOU USE ANY SUCH TRADING STRATEGIES, INDICATORS, SHOWME STUDIES, PAINTBAR STUDIES, PROBABILITYMAP STUDIES, ACTIVITYBAR
STUDIES, FUNCTIONS (OR ANY PARTS THEREOF) OR TECHNIQUES. THE USE OF THIS SHOW ME STUDY DOES NOT GUARANTEE THAT YOU WILL
MAKE PROFITS, INCREASE PROFITS, OR MINIMIZE LOSSES.}

{Quick-tip 91 explains a simple program for RadarScreen that displays the time when the highest volume for the day occured.
The quick-tip also explains the meaning of MaxBarsBack and Load Additional Bars for Accumulative Calculations as they
apply to RadarScreen. Even though the program is very simple, without the correct settings it will not function as intended.}

Vars:	int HighestVol( 0 ),
		string TimeHighestVol( " " );

// Clear the print log for a specific symbol
Once If GetSymbolName = "AVGO" then ClearPrintLog;

// Reset the highest volume at the beginning of the day
If D <> D[1] Then HighestVol = 0;

// If volume fo the current bar is greater than the highest volume for the day, then set highestvol to the bar's volume
// See https://help.tradestation.com/10_00/eng/tsdevhelp/elword/el_definitions/easylanguage_words_related_to_ticks,_volume_&_open_interest.htm
// for information about volume related keywords
If Ticks > HighestVol Then
Begin
	HighestVol = Ticks;
	TimeHighestVol = BarDateTime.ToString( );
End;

If GetSymbolName = "AVGO" and GetAppInfo( aiApplicationType  ) = 2
	then Print( GetSymbolName, " ", D, " ", T, " HighestVol ", HighestVol, "Volume", Ticks , " TimeHighestVol ", TimeHighestVol, "MaxBrsBack ", MaxBarsBack );

If GetAppInfo( aiApplicationType  ) = 2
then Plot1( TimeHighestVol, "TimeHVol", Yellow ); // Plot the time the highest volume occurred. Only in RadarScreen
Plot2( HighestVol, "HighestVol",Cyan ); // Plot the highest volume for the day
Plot3( Ticks, "BarVol", Magenta ); // Plot the volume for the current bar

{ ** Copyright (c) 2024 Markplex Corporation. All rights reserved. **
** Markplex Corporation reserves the right to modify or overwrite this analysis technique
on its https://markplex.com Web site. ** }
The following quick-tip gives additional information about the quirks of volume in TradeStation: https://markplex.com/free-tutorials/tradestation-easylanguage-quicktips/quick-tips-35-volume-gotchas/


TO THE BEST OF MARKPLEX CORPORATION’S KNOWLEDGE, ALL OF THE INFORMATION ON THIS PAGE IS CORRECT, AND IT IS PROVIDED IN THE HOPE THAT IT WILL BE USEFUL. HOWEVER, MARKPLEX CORPORATION ASSUMES NO LIABILITY FOR ANY DAMAGES, DIRECT OR OTHERWISE, RESULTING FROM THE USE OF THIS INFORMATION AND/OR PROGRAM(S) DESCRIBED, AND NO WARRANTY IS MADE REGARDING ITS ACCURACY OR COMPLETENESS. USE OF THIS INFORMATION AND/OR PROGRAMS DESCRIBED IS AT YOUR OWN RISK.
ANY EASYLANGUAGE OR POWERLANGUAGE TRADING STRATEGIES, SIGNALS, STUDIES, INDICATORS, SHOWME STUDIES, PAINTBAR STUDIES, PROBABILITYMAP STUDIES, ACTIVITYBAR STUDIES, FUNCTIONS (AND PARTS THEREOF) AND ASSOCIATED TECHNIQUES REFERRED TO, INCLUDED IN OR ATTACHED TO THIS TUTORIAL OR PROGRAM DESCRIPTION ARE EXAMPLES ONLY, AND HAVE BEEN INCLUDED SOLELY FOR EDUCATIONAL PURPOSES. MARKPLEX CORPORATION. DOES NOT RECOMMEND THAT YOU USE ANY SUCH TRADING STRATEGIES, SIGNALS, STUDIES, INDICATORS, SHOWME STUDIES, PAINTBAR STUDIES, PROBABILITYMAP STUDIES, ACTIVITYBAR STUDIES, FUNCTIONS (OR ANY PARTS THEREOF) OR TECHNIQUES. THE USE OF ANY SUCH TRADING STRATEGIES, SIGNALS, STUDIES, INDICATORS, SHOWME STUDIES, PAINTBAR STUDIES, PROBABILITYMAP STUDIES, ACTIVITYBAR STUDIES, FUNCTIONS AND TECHNIQUES DOES NOT GUARANTEE THAT YOU WILL MAKE PROFITS, INCREASE PROFITS, OR MINIMIZE LOSSES.

