Plotting Volume Weighted Average Price
If you create an indicator as follows and apply it to a chart:
Plot1( VWAP );
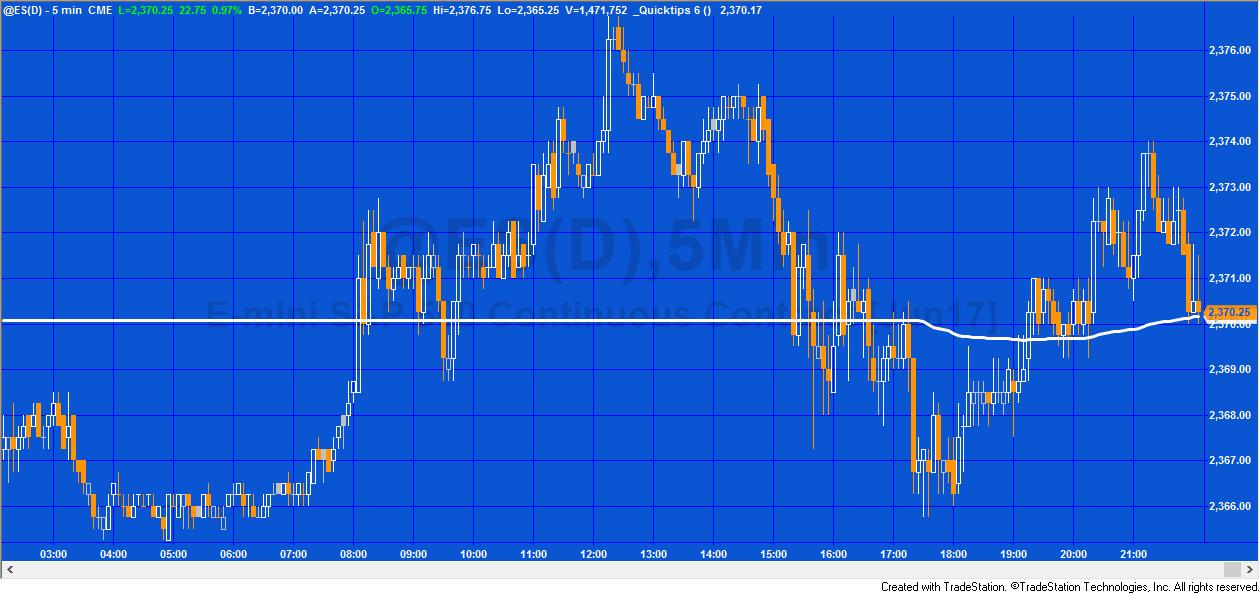
You will probably see something similar to this:
The reason for this is that Volume Weighted Average Price (VWAP) is a quote fields (a TradeStation Reserved word) that returns a real time snap shot of the value. Quote fields do not reference history.
Other quote fields include: AskSize, AskTime, BidSize, DailyClose, DailyHigh, DailyVolume etc
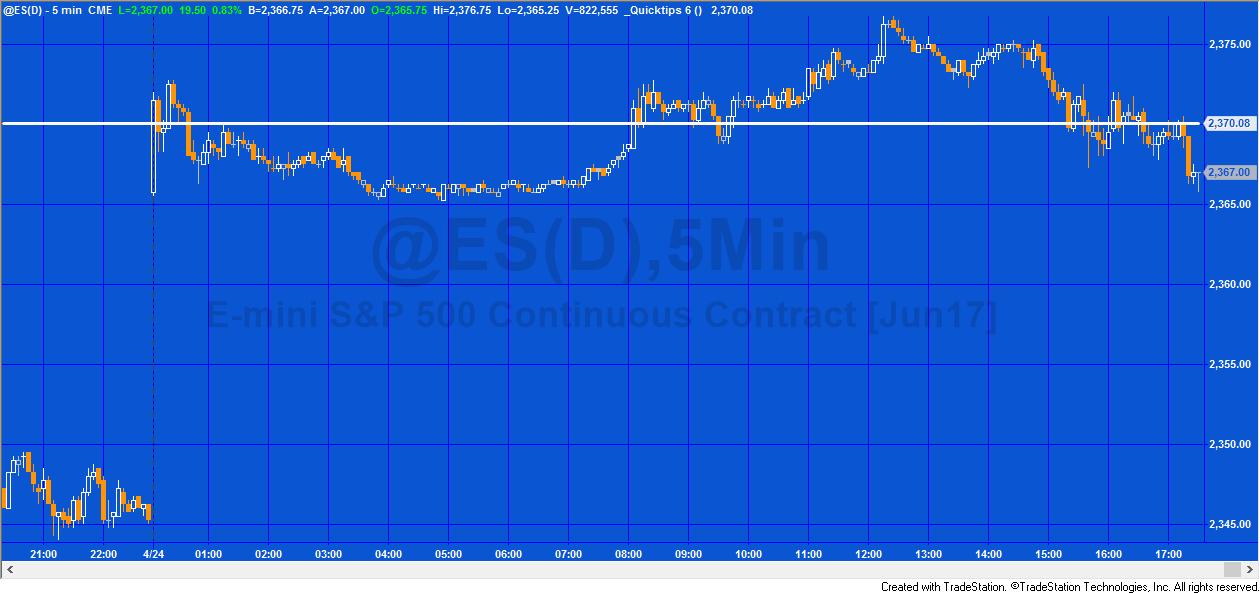
After we have applied the program to a chart we will then see plot values from the current bar forward.