
Quicktip 59 is designed to be applied to intraday charts. It calculates whether the currently forming daily bar (or completed daily bars) is a hammer or inverse hammer pattern in its current state of development (i.e. if you took a snapshot of the daily bar (so far) is it a hammer or inverse hammer pattern?)
See how hammer pattern is defined in this quick tip below.
The quick tip is based on program 54 which is a strategy that uses hammer and inverse hammer patterns in its algorithm. Quick tip 59 uses the OpenD( 0 ), HighD( 0 ), and LowD( 0 ) functions which provide the open, high and low of the current day.
This quick tip also gives an example of the use of the _Quicktip59_FN function. The function returns -1 for an inverse hammer pattern and returns + 1 for a hammer pattern.
Hammer pattern
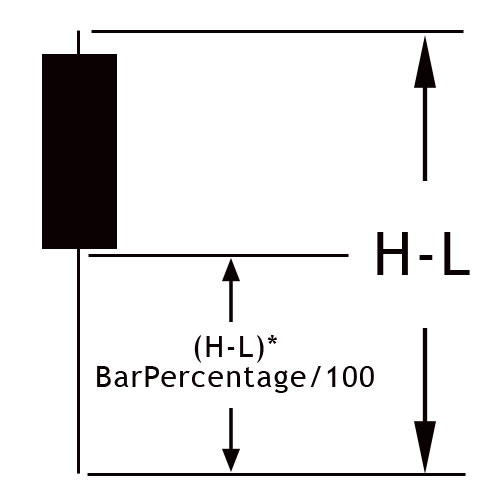
In this program, the hammer pattern is defined as when the body of the candle is relatively small compared to the wick and occurs above the middle horizontal line shown in the image to the right. A user input: BarPercentage determines the exact position of the middle horizontal line.
Similarly, an inverse hammer pattern is defined as when the body of the candle is relatively small compared to the wick and occurs below the middle horizontal line. For inverse hammer patterns the position of the middle line is measured from the high of the bar.
The formulae for determining the patterns are:
Hammer definition
Inverse hammer definition
It would be relatively straightforward to modify this if you required a more stringent definition of a hammer (for example, if the close or open had to be near or at the top of the bar for a hammer pattern).
Download for Gold Pass members
If you are a Gold Pass member you can download the tutorial ELD file below, please make sure that you are logged in with your Gold Pass user name and password.
THESE INDICATORS, SHOW ME STUDIES, STRATEGIES AND OTHER PROGRAMS HAVE BEEN INCLUDED SOLELY FOR EDUCATIONAL PURPOSES.
TO THE BEST OF MARKPLEX CORPORATION’S KNOWLEDGE, ALL OF THE INFORMATION ON THIS PAGE IS CORRECT, AND IT IS PROVIDED IN THE HOPE THAT IT WILL BE USEFUL. HOWEVER, MARKPLEX CORPORATION ASSUMES NO LIABILITY FOR ANY DAMAGES, DIRECT OR OTHERWISE, RESULTING FROM THE USE OF THIS INFORMATION AND/OR PROGRAM(S) DESCRIBED, AND NO WARRANTY IS MADE REGARDING ITS ACCURACY OR COMPLETENESS. USE OF THIS INFORMATION AND/OR PROGRAMS DESCRIBED IS AT YOUR OWN RISK.
ANY EASYLANGUAGE OR POWERLANGUAGE TRADING STRATEGIES, SIGNALS, STUDIES, INDICATORS, SHOWME STUDIES, PAINTBAR STUDIES, PROBABILITYMAP STUDIES, ACTIVITYBAR STUDIES, FUNCTIONS (AND PARTS THEREOF) AND ASSOCIATED TECHNIQUES REFERRED TO, INCLUDED IN OR ATTACHED TO THIS TUTORIAL OR PROGRAM DESCRIPTION ARE EXAMPLES ONLY, AND HAVE BEEN INCLUDED SOLELY FOR EDUCATIONAL PURPOSES. MARKPLEX CORPORATION. DOES NOT RECOMMEND THAT YOU USE ANY SUCH TRADING STRATEGIES, SIGNALS, STUDIES, INDICATORS, SHOWME STUDIES, PAINTBAR STUDIES, PROBABILITYMAP STUDIES, ACTIVITYBAR STUDIES, FUNCTIONS (OR ANY PARTS THEREOF) OR TECHNIQUES. THE USE OF ANY SUCH TRADING STRATEGIES, SIGNALS, STUDIES, INDICATORS, SHOWME STUDIES, PAINTBAR STUDIES, PROBABILITYMAP STUDIES, ACTIVITYBAR STUDIES, FUNCTIONS AND TECHNIQUES DOES NOT GUARANTEE THAT YOU WILL MAKE PROFITS, INCREASE PROFITS, OR MINIMIZE LOSSES.