

Calculate the associated trendline volume for manually drawn trend lines
Tutorial 111 demonstrates how to create a TradeStation EasyLanguage showme study designed to calculate the cumulative volume for the bars encompassed by the trend lines (trendline volume) for trend lines drawn using the TradeStation drawing tool.
- Volume
- Ticks
- UpTicks
- DownTicks
- OpenInt
have different meanings depending on the symbol, the bar length of a chart and the “for volume use trade volume or tick count” settings. For more information see the TradeStation wiki (you will need to log in to TradeStation) TradeStation Wiki
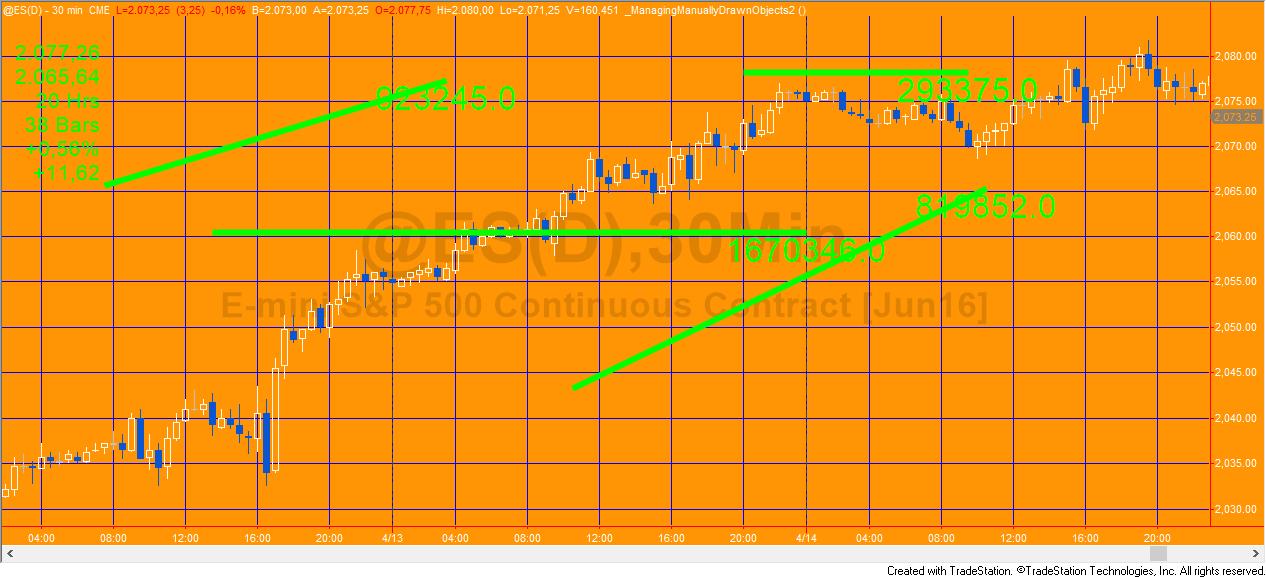
The idea for the tutorial came from a Gold Pass member. It includes a demonstration of how to analyze trend lines that have been manually applied to a TradeStation chart by the chart drawing tool. It also shows how to create a Textlabel that is associated with and is updated and moves with the Trendline, when the trendline is relocated and/or resized.
There are several challenges in creating such a program including issues relating to event methods associated with trend line objects and charting host objects. If you are unfamiliar with these terms, I explain more in the video below.
EasyLanguage technical lessons
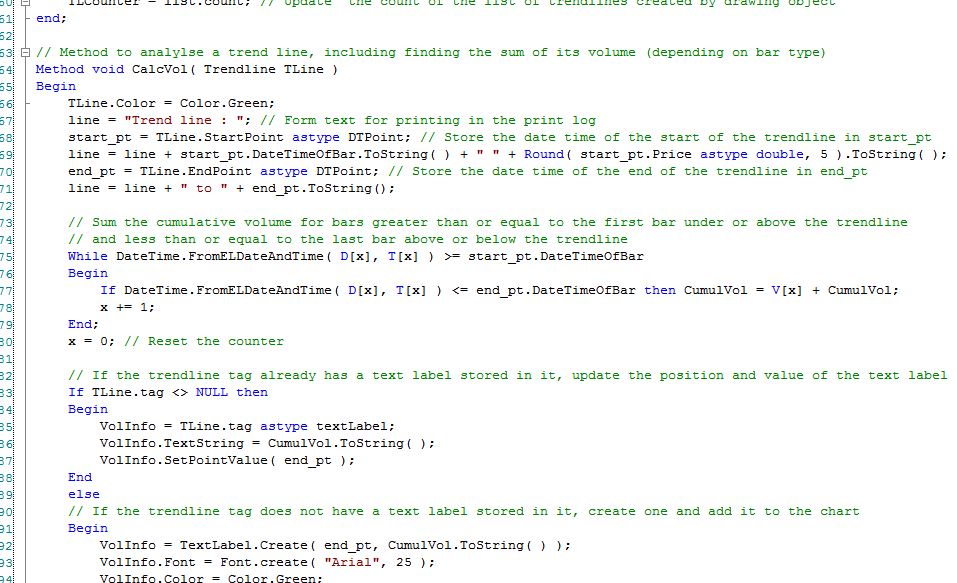
In the tutorial video and the program comments you will learn:
- Using the TradeStation drawing tools to draw a Trendline
- Using the TradeStation drawing tools to format a Trendline
- The use of a vector to store Trendline objects
- Drawing, moving and formatting Textlabel objects
- Trendline click events
- Chartinghost click events
- The use of the Trendline tag to store a Textlabel object
There are actually two different approaches demonstrated in this tutorial. I have named them program 1 and program 2.
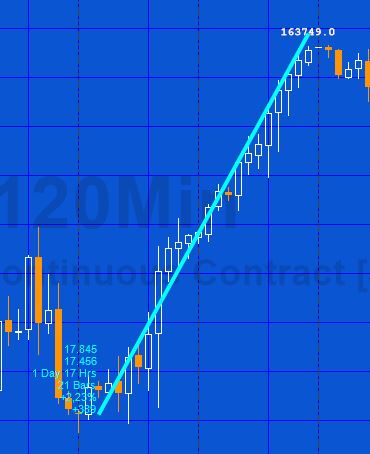
Both programs, essentially, do the same thing. They look for manually drawn trendlines, calculate the volume of the bars encompassed by the trendline and display this value as a text label. If the trendline is moved or resized the text information is updated and the label moved.
All the lines that are on the chart when the program is first applied (or when refreshed) are analysed.
The keyword for volume: V is used in the program. If you wished to use a different volume related keyword (for example: Upticks) it would be straightforward to change the program, replacing “V” with “UpTicks.”
Trendline volume program 1
In program 1 the program uses the charting host to indicate when a chart element has been clicked. When a click is detected, ALL the trendlines are recalculated and the information is updated. This means that when a specific trendline is clicked, ALL the trendlines are updated. The trendlines are updated even when the element clicked was not changed or the element clicked was not even a trendline.
This methodology works, but is potentially wasteful of resources, especially if you had a large number of trendlines drawn on the chart.
Trendline volume program 2
In program 2 I use a slightly more sophisticated approach. When a trendline is clicked (mouse down), that specific trendline is updated. When the chartinghost event indicates a mouse up event has occurred the most recently clicked trendline is updated.
While this approach is not perfect. It does reduces the amount of processing that needs to be done.
Both programs demonstrate some useful techniques and programming concepts.
Program downloadable for free by Gold Pass members
Inputs
Neither of the programs created in this tutorial have inputs although you may like to convert some of the things that have been hard coded in the program to inputs, for example the color of the lines and text, or the horizontal position of the text.
Tutorial 111 download
Tutorial 111 (two UNPROTECTED show me studies) is available for IMMEDIATE download for $19.95 by clicking the ‘add to cart’ button.
After download the programs can be opened, you will be able to see the program code and modify it if you wish.
After purchase you will be redirected to a download page, so don’t close the browser.
The download ELD includes two programs:
- _Tutorial111-program1
- _Tutorial111-program2
Note that both program names begin with an underscore, so they should be towards the start of the list if you sort alphabetically.
Tutorial 111 was developed for TradeStation 9.5 and will not work with MultiCharts.
Video demonstration of tutorial 111 (part 1)
Video demonstration of tutorial 111 (part 2)
Corrections
If you notice any errors or have other comments about the programs, please email.
1. In the video for part two I described lines 108–112:
For Ctr = 0 to list.Count – 1
begin
If ( list[ Ctr ] astype TrendLine ) = TLClicked then CalcVol( ( list[ Ctr ] astype TrendLine ) );
End;
This is unnecessary and can be replaced by:
2. The programs demonstrated in the videos leave a ‘stray’ text label on the chart, if the associated trendline is deleted. The following is some code to resolve this issue. This is not guaranteed to work in all situations (for example if you have a mixture of hand drawn and program created trendlines or other drawing objects.)
First, add ChartingHost1.predeleteelement += ChartingHost1_PreDeleteElement; to the InitializeComponent( ) method:
begin
ChartingHost1 = new ChartingHost; // Instantiate occurence of charting host
ChartingHost1.chartelementclick += ChartingHost1_ChartElementClick; // Create event for when mouse button released after clicking a chart element
ChartingHost1.predeleteelement += ChartingHost1_PreDeleteElement;
end;
and create a ChartingHost1_PreDeleteElement method:
begin
//Print(” Something deleted ” );
If args.Type = ChartVisualElementType.drawingobject then
If TLClicked <> NULL and ( args.Element astype DrawingObjectVisualElement ).name = “Trendline”
then DrawingObjects.Delete( TLClicked.Tag astype TextLabel );
end;
The download programs have been updated with these changes.
Please note that any screen shots on this site are examples and are not meant to imply that any of these programs will generate profitable trades.
THESE INDICATORS, SHOW ME STUDIES, STRATEGIES AND OTHER PROGRAMS HAVE BEEN INCLUDED SOLELY FOR EDUCATIONAL PURPOSES.
TO THE BEST OF MARKPLEX CORPORATION’S KNOWLEDGE, ALL OF THE INFORMATION ON THIS PAGE IS CORRECT, AND IT IS PROVIDED IN THE HOPE THAT IT WILL BE USEFUL. HOWEVER, MARKPLEX CORPORATION ASSUMES NO LIABILITY FOR ANY DAMAGES, DIRECT OR OTHERWISE, RESULTING FROM THE USE OF THIS INFORMATION AND/OR PROGRAM(S) DESCRIBED, AND NO WARRANTY IS MADE REGARDING ITS ACCURACY OR COMPLETENESS. USE OF THIS INFORMATION AND/OR PROGRAMS DESCRIBED IS AT YOUR OWN RISK.
ANY EASYLANGUAGE OR POWERLANGUAGE TRADING STRATEGIES, SIGNALS, STUDIES, INDICATORS, SHOWME STUDIES, PAINTBAR STUDIES, PROBABILITYMAP STUDIES, ACTIVITYBAR STUDIES, FUNCTIONS (AND PARTS THEREOF) AND ASSOCIATED TECHNIQUES REFERRED TO, INCLUDED IN OR ATTACHED TO THIS TUTORIAL OR PROGRAM DESCRIPTION ARE EXAMPLES ONLY, AND HAVE BEEN INCLUDED SOLELY FOR EDUCATIONAL PURPOSES. MARKPLEX CORPORATION. DOES NOT RECOMMEND THAT YOU USE ANY SUCH TRADING STRATEGIES, SIGNALS, STUDIES, INDICATORS, SHOWME STUDIES, PAINTBAR STUDIES, PROBABILITYMAP STUDIES, ACTIVITYBAR STUDIES, FUNCTIONS (OR ANY PARTS THEREOF) OR TECHNIQUES. THE USE OF ANY SUCH TRADING STRATEGIES, SIGNALS, STUDIES, INDICATORS, SHOWME STUDIES, PAINTBAR STUDIES, PROBABILITYMAP STUDIES, ACTIVITYBAR STUDIES, FUNCTIONS AND TECHNIQUES DOES NOT GUARANTEE THAT YOU WILL MAKE PROFITS, INCREASE PROFITS, OR MINIMIZE LOSSES.