

Welcome to tutorial 10 in this series of tutorials designed to introduce basic EasyLanguage concepts.
In tutorials 8 and 9, I introduced functions. Functions are extremely useful for performing calculations that you might need to use in future EasyLanguage strategies or indicators that you may create. By using functions, you do not need to keep rewriting parts of your programs that you use frequently. Functions can also be helpful because they take a portion of your EasyLanguage code out of a ‘main’ program into a function. By doing this they make the program easier to read and understand.
This tutorial introduces PaintBar studies. PaintBar studies draw a line though an existing bar and are great for adding more information to a chart without the chart becoming too cluttered. By way of example, we will create a demonstration Paintbar study to highlight pivots on a chart.
Step 1
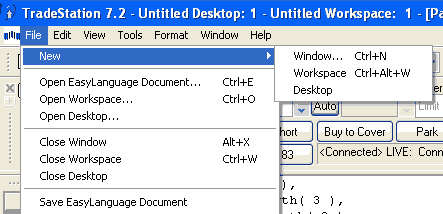
Creating a PaintBar study starts with the same procedure we have used before:
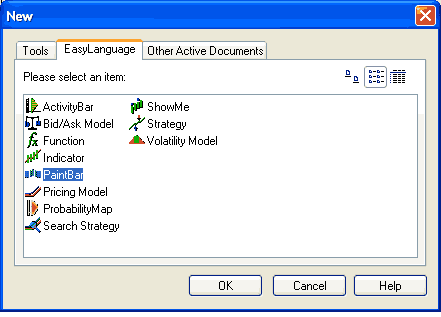
Step 2
Select PaintBar and click OK.
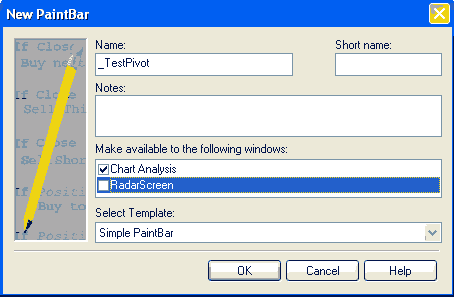
Step 3
Name the PaintBar study. Since we are just going to apply the PaintBar study to a chart, click the RadarScreen button, and click OK.
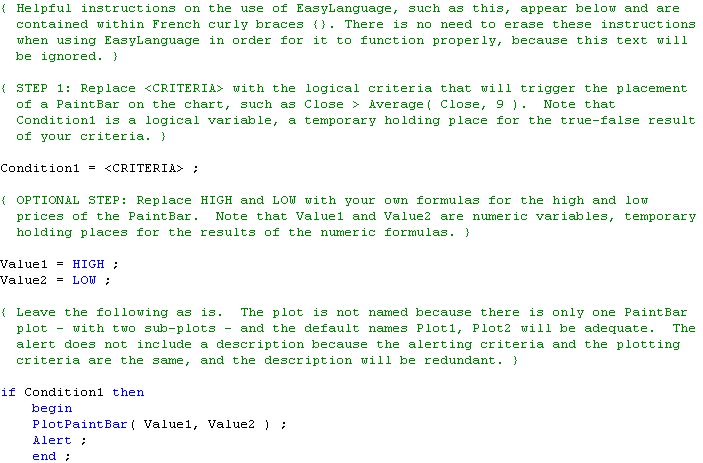
Step 4
You will see the following default text. This is often useful in reminding you of the basic syntax. I tend to use it as a guideline and gradually delete the parts I do not need. It is particularly useful in this case in highlighting the difference in syntax between the Plot statement in a ShowMe study or indicator.
Step 5
Enter the following program:
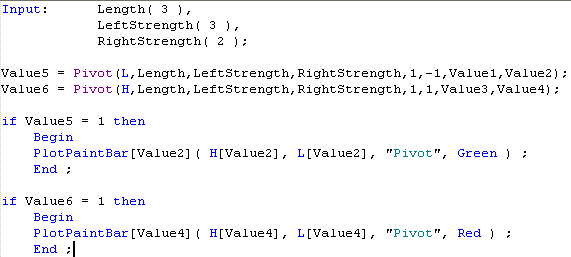
The first Pivot statement is looking for low pivots, the second is looking for high pivots. Left strength and right strength are set as inputs. If you are unsure of the syntax of the pivot statement, when you have entered the program into TradeStation, right-click the word Pivot and select definition of the function. Value2 is set to the number of bars ago that a low pivot occurred. Value4 is set to the number of bars ago that a high pivot took place.
The if statements determine whether a pivot has taken place, e.g. Value 5 =1. If it has the bar is painted using the PlotPaintBar statement. Lets look at the statement in detail:
PlotPaintBar[Value4]( H[Value4], L[Value4], “Pivot”, Red);
The first set of square brackets tells the statement how many bars ago to do the plot. The H[Value4] tells the PlotPaintBar the high value of the plot. Note that the high value Value4 bars ago is used – not the current high. Similarly for the low value – L[Value4]. The name of the plot is included in quotes and finally the color is included. There are a few other options (such as width) that you can use. Again if you want to study the syntax in detail, right click the word PlotPaintBar in your program.
Step 6
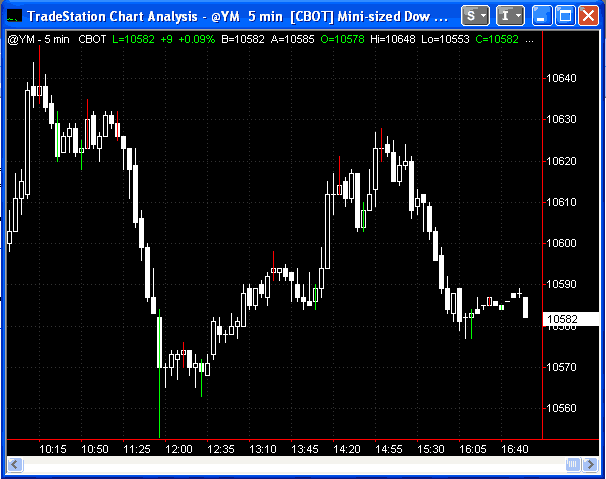
Finally, apply the PaintBar study to a chart – and you should see something like the following:

Copy the tutorial 10 TradeStation EasyLanguage code for Gold Pass members
If you are a Gold Pass member you can copy the tutorial code below, please make sure that you are logged in with your Gold Pass user name and password.
Summary
This tutorial demonstrates the creation of a simple Paintbar study. PaintBar studies are great ways of adding information to a chart without cluttering up the chart.
If you have any questions about the above material or you would like to point out a correction or typo, please e-mail: tutorials@markplex.com.
TO THE BEST OF MARKPLEX CORPORATION’S KNOWLEDGE, ALL OF THE INFORMATION ON THIS PAGE IS CORRECT, AND IT IS PROVIDED IN THE HOPE THAT IT WILL BE USEFUL. HOWEVER, MARKPLEX CORPORATION ASSUMES NO LIABILITY FOR ANY DAMAGES, DIRECT OR OTHERWISE, RESULTING FROM THE USE OF THIS INFORMATION AND/OR PROGRAM(S) DESCRIBED, AND NO WARRANTY IS MADE REGARDING ITS ACCURACY OR COMPLETENESS. USE OF THIS INFORMATION AND/OR PROGRAMS DESCRIBED IS AT YOUR OWN RISK.
ANY EASYLANGUAGE OR POWERLANGUAGE TRADING STRATEGIES, SIGNALS, STUDIES, INDICATORS, SHOWME STUDIES, PAINTBAR STUDIES, PROBABILITYMAP STUDIES, ACTIVITYBAR STUDIES, FUNCTIONS (AND PARTS THEREOF) AND ASSOCIATED TECHNIQUES REFERRED TO, INCLUDED IN OR ATTACHED TO THIS TUTORIAL OR PROGRAM DESCRIPTION ARE EXAMPLES ONLY, AND HAVE BEEN INCLUDED SOLELY FOR EDUCATIONAL PURPOSES. MARKPLEX CORPORATION. DOES NOT RECOMMEND THAT YOU USE ANY SUCH TRADING STRATEGIES, SIGNALS, STUDIES, INDICATORS, SHOWME STUDIES, PAINTBAR STUDIES, PROBABILITYMAP STUDIES, ACTIVITYBAR STUDIES, FUNCTIONS (OR ANY PARTS THEREOF) OR TECHNIQUES. THE USE OF ANY SUCH TRADING STRATEGIES, SIGNALS, STUDIES, INDICATORS, SHOWME STUDIES, PAINTBAR STUDIES, PROBABILITYMAP STUDIES, ACTIVITYBAR STUDIES, FUNCTIONS AND TECHNIQUES DOES NOT GUARANTEE THAT YOU WILL MAKE PROFITS, INCREASE PROFITS, OR MINIMIZE LOSSES.