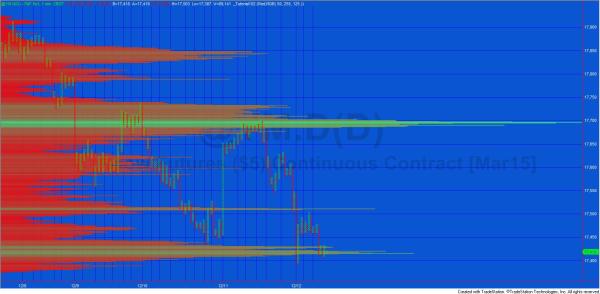
Tick profile histogram created using a price series provider (PSP)
Welcome to Markplex tutorial 102 in this collection of tutorials designed to help you learn TradeStation EasyLanguage programming skills. Please join our email list if you have not already done so and we will let you know when we release new tutorials or programs.
This tutorial applies to TradeStation (but not MultiCharts) because it uses some of TradeStation’s object oriented extensions.
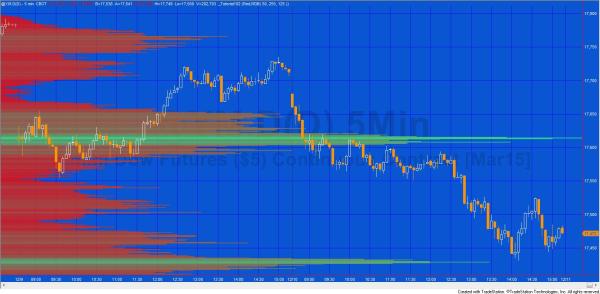
Functionality overview
Tutorial 102 uses a price series provider to analyze tick data to calculate the total number of ticks for each price level on the visible window of a chart. The data is stored and sorted using a dictionary and vectors. Lines are then drawn on a chart in the form of a histogram with the longest lines representing a greater number of ticks. The color of the histogram lines varies continually in relation to the total number of ticks at any specific price level. The colors are set using user inputs.
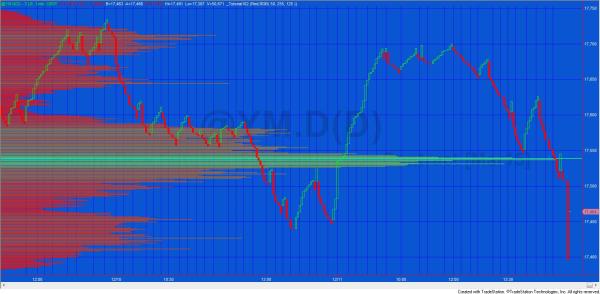
The program does a lot of processing and so it has been created as not real time. In other words, it does a calculation when first applied to the chart and then makes no other changes. It can be used with point and figure, line break etc charts
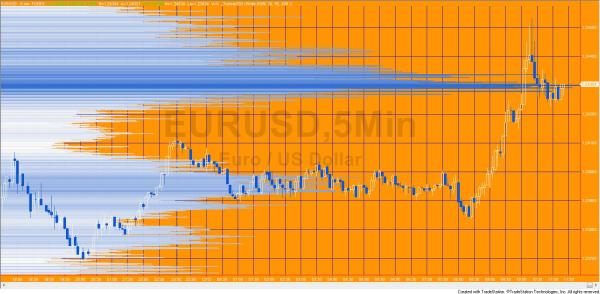
The tutorial demonstrates the drawing of the histogram lines in two different ways. The first is by using DTpoints and the second using XYpoints.
Tutorial lessons
Tutorial 102 demonstrates the use of
- a price series provider,
- vectors (including sorting vectors),
- a dictionary,
- drawing trend lines and rectangles using the new drawing object functionality.
See the video below to understand how the program works.
Inputs
HistColor1( Red ), // Color of prices at which the least volume occurred
HistColor2( RGB( 50, 255, 125 ) ); // Color of the lines at which the most volume occurred
This tutorial program is available for immediate download for only $39.95. This tutorial applies to TradeStation (but not MultiCharts) because it uses some of TradeStation’s object oriented extensions.
Gold pass members can download the program at no cost (see the Gold Pass area below. Make sure you are logged in to the site).
Gold pass area
Tutorial 102 video part 1
For best results, watch this video in full screen HD mode.
Tutorial 102 video part 2
This tutorial program is available for immediate download for only $39.95. This tutorial applies to TradeStation (but not MultiCharts) because it uses some of TradeStation’s object oriented extensions.
Gold Pass members get an additional 20% discount off all program and tutorial prices. If you are a Gold Pass member make sure you enter the special coupon code to get 20% discount off these prices. You can find the coupon code on the Gold Pass page.
TO THE BEST OF MARKPLEX CORPORATION’S KNOWLEDGE, ALL OF THE INFORMATION ON THIS PAGE IS CORRECT, AND IT IS PROVIDED IN THE HOPE THAT IT WILL BE USEFUL. HOWEVER, MARKPLEX CORPORATION ASSUMES NO LIABILITY FOR ANY DAMAGES, DIRECT OR OTHERWISE, RESULTING FROM THE USE OF THIS INFORMATION AND/OR PROGRAM(S) DESCRIBED, AND NO WARRANTY IS MADE REGARDING ITS ACCURACY OR COMPLETENESS. USE OF THIS INFORMATION AND/OR PROGRAMS DESCRIBED IS AT YOUR OWN RISK.
ANY EASYLANGUAGE OR POWERLANGUAGE TRADING STRATEGIES, SIGNALS, STUDIES, INDICATORS, SHOWME STUDIES, PAINTBAR STUDIES, PROBABILITYMAP STUDIES, ACTIVITYBAR STUDIES, FUNCTIONS (AND PARTS THEREOF) AND ASSOCIATED TECHNIQUES REFERRED TO, INCLUDED IN OR ATTACHED TO THIS TUTORIAL OR PROGRAM DESCRIPTION ARE EXAMPLES ONLY, AND HAVE BEEN INCLUDED SOLELY FOR EDUCATIONAL PURPOSES. MARKPLEX CORPORATION. DOES NOT RECOMMEND THAT YOU USE ANY SUCH TRADING STRATEGIES, SIGNALS, STUDIES, INDICATORS, SHOWME STUDIES, PAINTBAR STUDIES, PROBABILITYMAP STUDIES, ACTIVITYBAR STUDIES, FUNCTIONS (OR ANY PARTS THEREOF) OR TECHNIQUES. THE USE OF ANY SUCH TRADING STRATEGIES, SIGNALS, STUDIES, INDICATORS, SHOWME STUDIES, PAINTBAR STUDIES, PROBABILITYMAP STUDIES, ACTIVITYBAR STUDIES, FUNCTIONS AND TECHNIQUES DOES NOT GUARANTEE THAT YOU WILL MAKE PROFITS, INCREASE PROFITS, OR MINIMIZE LOSSES.

