

Drawing trendlines using BNPoint objects on a sub graph
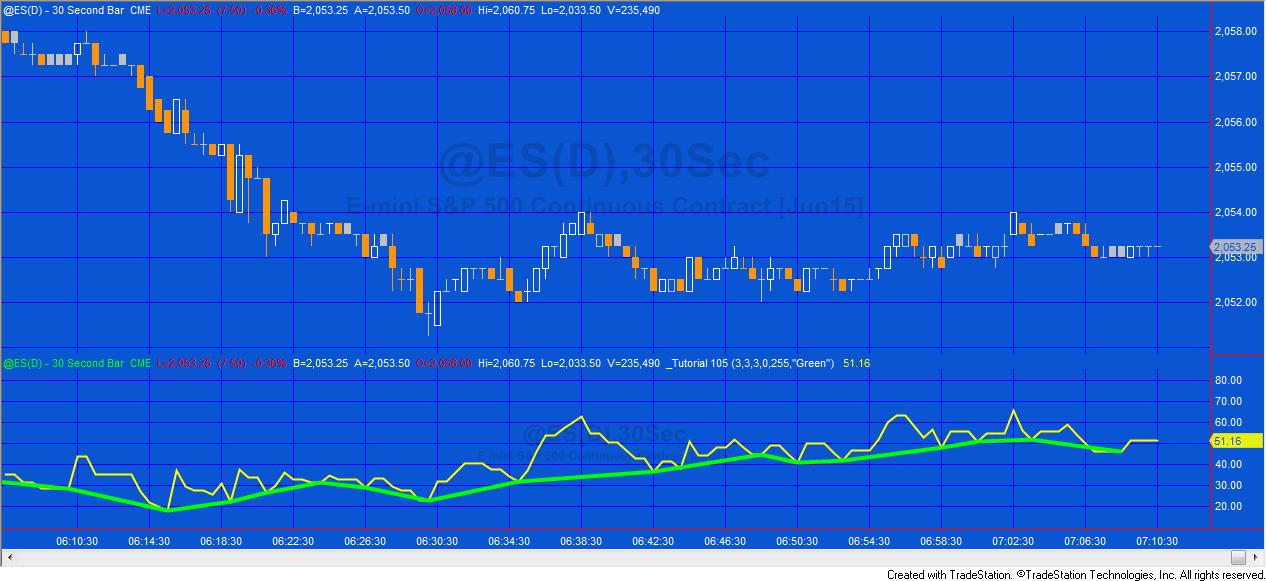
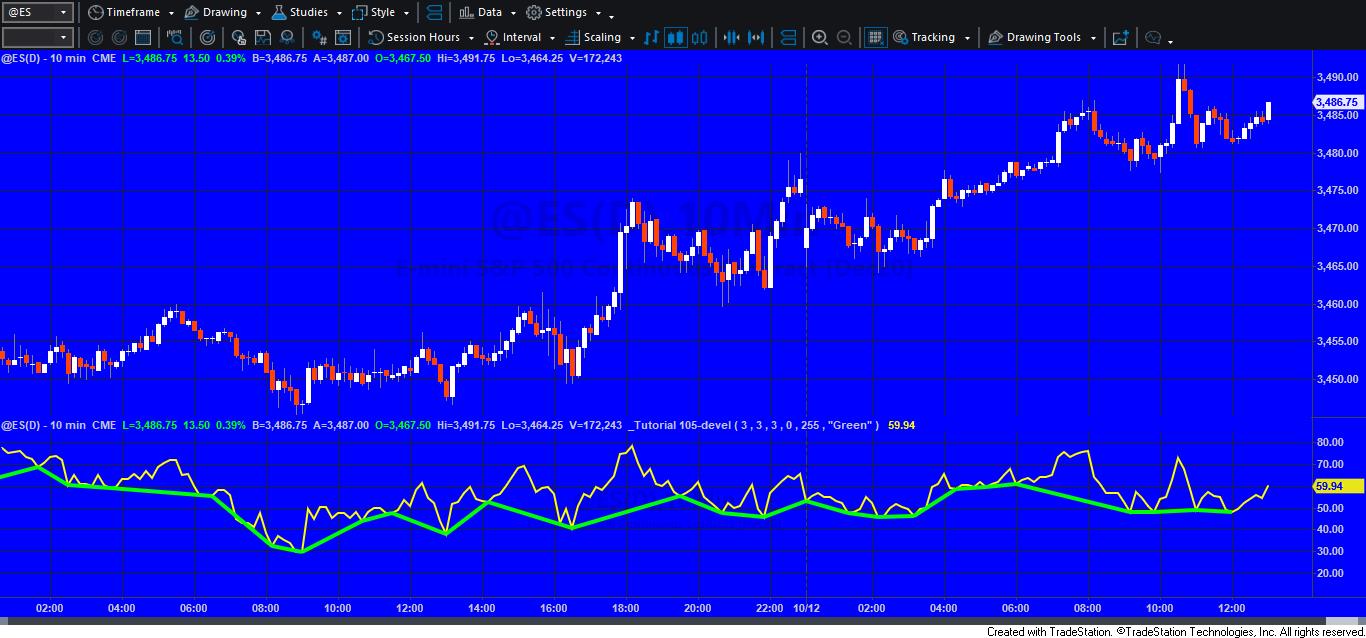
Tutorial 105 is a TradeStation EasyLanguage tutorial that demonstrates how to draw trend lines using TradeStation drawing objects on a sub-graph containing an RSI indicator. This builds on the technique described in tutorial 104. One of the advantages of using this technique (when compared to TradeStation legacy trendlines) is that it is possible to draw the line to an exact bar. This means that this technique can be used on seconds, tick and other charts where a several bars may share same data and time (when expressed in minutes).
In this tutorial I draw trend lines between adjacent low pivots on the RSI plot.
This tutorial applies to TradeStation (but not MultiCharts) because it uses TradeStation’s new drawing objects.
Two potential ‘gotchas’
Gotcha 1
A BNPoint refers to the absolute bar index (zero-based) of the collection of bars in a chart. This is not the same as the BarNumber function or CurrentBar reserved word which count the number of bars available for analysis after MaxBarsBack. So to create a BNPoint for the current bar (BarNumber) would be:
NewBar = BarNumber + MaxBarsBack – 1;
Gotcha 2
Another issue that can cause what appear to be spurious results are the ‘Show empty daily trading periods for traditional chart types’ and ‘Show empty intraday session periods for traditional chart types’ settings.
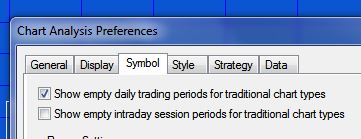
If these are selected, the chart includes blank bars which ‘confuse’ the bar number for BNPoints. For example, in the following daily chart of IBM, the ‘Show empty daily trading periods for traditional chart types’ is selected.
This tutorial program is available for immediate download for only $19.95. This tutorial applies to TradeStation (but not MultiCharts) because it uses TradeStation’s object oriented extensions.
Gold pass members can download the program at no cost (see the Gold Pass area below. Make sure you are logged in to the site).
Tutorial 105 video
Gold pass area
This tutorial program is available for immediate download for only $19.95. This tutorial applies to TradeStation (but not MultiCharts) because it uses TradeStation’s object oriented extensions.
Gold pass members can download the program at no cost (see the Gold Pass area below. Make sure you are logged in to the site).
Gold Pass members get an additional 20% discount off all program and tutorial prices. If you are a Gold Pass member make sure you enter the special coupon code to get 20% discount off these prices. You can find the coupon code on the Gold Pass page.
Please join our email list if you have not already done so and we will let you know when we release new tutorials or programs.
TO THE BEST OF MARKPLEX CORPORATION’S KNOWLEDGE, ALL OF THE INFORMATION ON THIS PAGE IS CORRECT, AND IT IS PROVIDED IN THE HOPE THAT IT WILL BE USEFUL. HOWEVER, MARKPLEX CORPORATION ASSUMES NO LIABILITY FOR ANY DAMAGES, DIRECT OR OTHERWISE, RESULTING FROM THE USE OF THIS INFORMATION AND/OR PROGRAM(S) DESCRIBED, AND NO WARRANTY IS MADE REGARDING ITS ACCURACY OR COMPLETENESS. USE OF THIS INFORMATION AND/OR PROGRAMS DESCRIBED IS AT YOUR OWN RISK.
ANY EASYLANGUAGE OR POWERLANGUAGE TRADING STRATEGIES, SIGNALS, STUDIES, INDICATORS, SHOWME STUDIES, PAINTBAR STUDIES, PROBABILITYMAP STUDIES, ACTIVITYBAR STUDIES, FUNCTIONS (AND PARTS THEREOF) AND ASSOCIATED TECHNIQUES REFERRED TO, INCLUDED IN OR ATTACHED TO THIS TUTORIAL OR PROGRAM DESCRIPTION ARE EXAMPLES ONLY, AND HAVE BEEN INCLUDED SOLELY FOR EDUCATIONAL PURPOSES. MARKPLEX CORPORATION. DOES NOT RECOMMEND THAT YOU USE ANY SUCH TRADING STRATEGIES, SIGNALS, STUDIES, INDICATORS, SHOWME STUDIES, PAINTBAR STUDIES, PROBABILITYMAP STUDIES, ACTIVITYBAR STUDIES, FUNCTIONS (OR ANY PARTS THEREOF) OR TECHNIQUES. THE USE OF ANY SUCH TRADING STRATEGIES, SIGNALS, STUDIES, INDICATORS, SHOWME STUDIES, PAINTBAR STUDIES, PROBABILITYMAP STUDIES, ACTIVITYBAR STUDIES, FUNCTIONS AND TECHNIQUES DOES NOT GUARANTEE THAT YOU WILL MAKE PROFITS, INCREASE PROFITS, OR MINIMIZE LOSSES.