
Tutorial 109 part 2 | Real time versions
Summary of the original tutorial 109
In the original tutorial 109 I demonstrated how to create an indicator to calculate the duration of a volume bar. The tutorial calculated the duration of a bar by subtracting the time of the last tick of the previous bar from the time of the closing tick of the volume bar for which we are trying to find the duration. This assumed that the closing time of the last bar is the same as the opening time of the bar we are looking at. This is not the case. For example, when a new day begins on the @ES.D chart, the closing time of the last bar of the previous day took place some considerable time before the opening of the first bar of the new day.
When real time bars start to arrive we are now able to record the start time and end time of each bar.
_Tutorial 109 Real Time Video Version
A Markplex client asked whether it would be possible to modify the tutorial 109 program as follows:
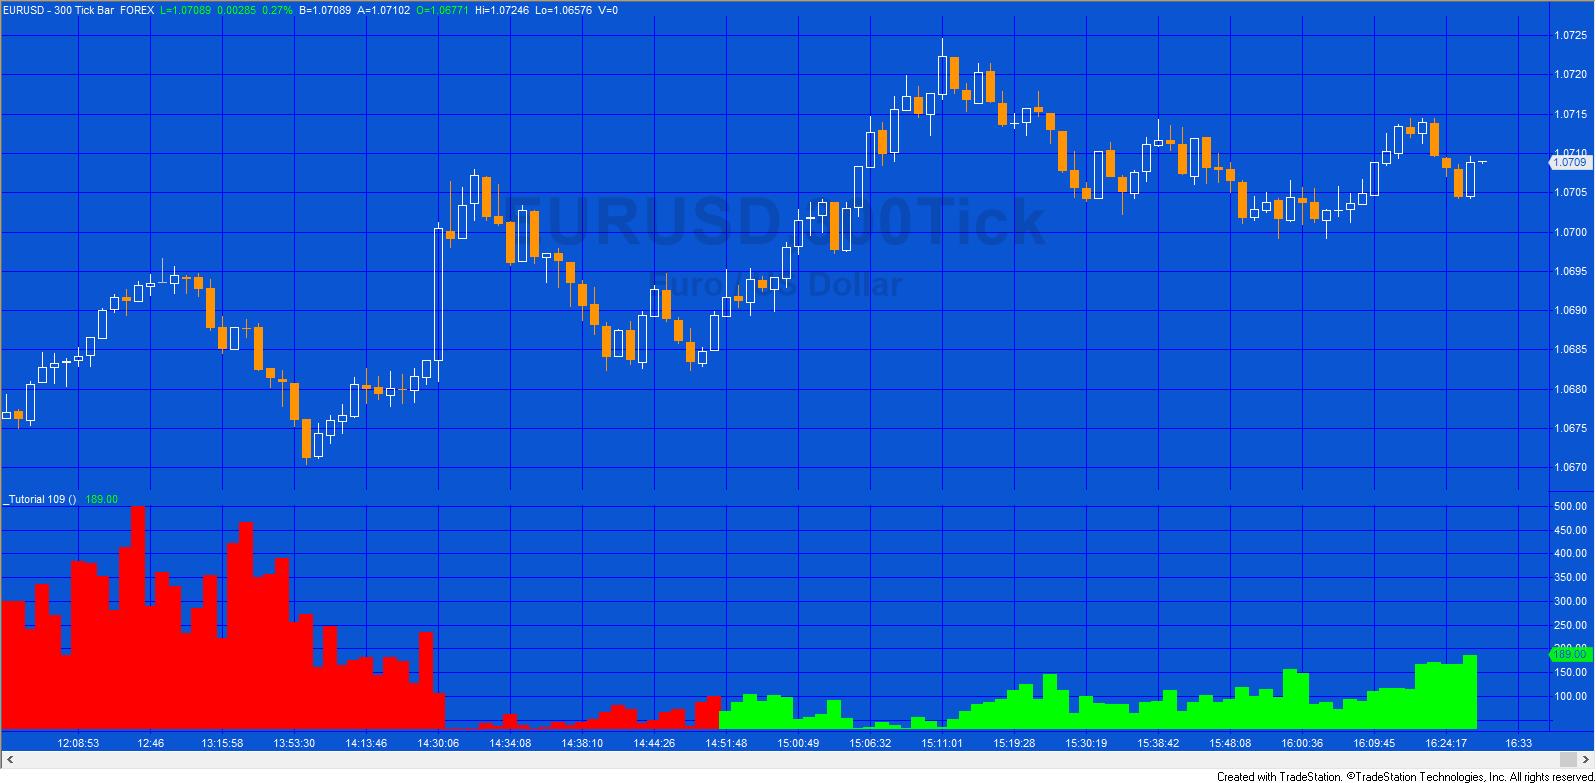
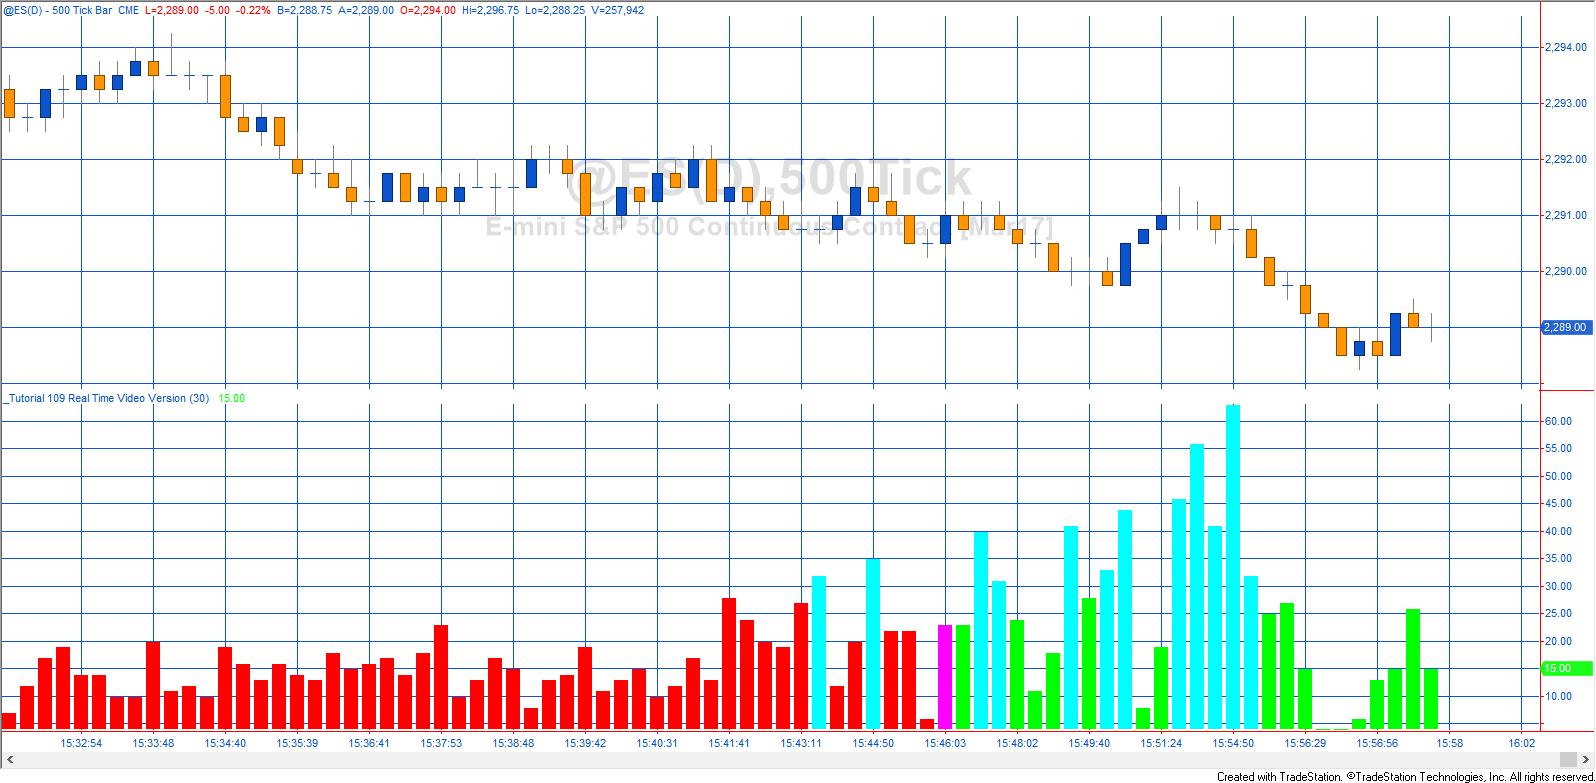
- Plot the histogram for real time bars as they develop
- Make the historic bars one color and the real time bars another color
- Create an alert for when the indicator plots a volume time bar greater than a user input value
- Change the color of a volume time bar when it goes over a user input value
I created a new version of tutorial 109 named “_Tutorial 109 Real Time Video Version“. In the video below I highlight the changes that I had to make to the original program to achieve this new functionality.
The tutorial is really intended for continuous symbols and I removed a feature from the original program that calculated the bar duration from the beginning of the session for the first bar of the day. This means that, for non-continuous symbols a very large bar volume time bar appears for the first bar of the session.
If you wanted to use the program with non-continuous symbols, you can modify the program to exclude the difficult bar, or alternatively, set the scale of the sub graph manually.
The new program is available for download, or can be copied for free by Gold Pass members.
_Tutorial 109 Real Time Video Version has a single input: AlertDuration. If a volume time bar exceeds this value its color in changed.
For the sake of simplicity, all the colors in _Tutorial 109 Real Time Video Version are hard coded.
Video of _Tutorial 109 Real Time Video Version
Protected area for Gold pass members
The following area contains the code for _Tutorial 109 Real Time Video Version. Make sure that you are logged in with your Gold Pass credentials to be able to see and copy the code.
Gold Pass members may copy the code from the Gold Pass area above for free. Make sure that you are logged into your Gold Pass account.
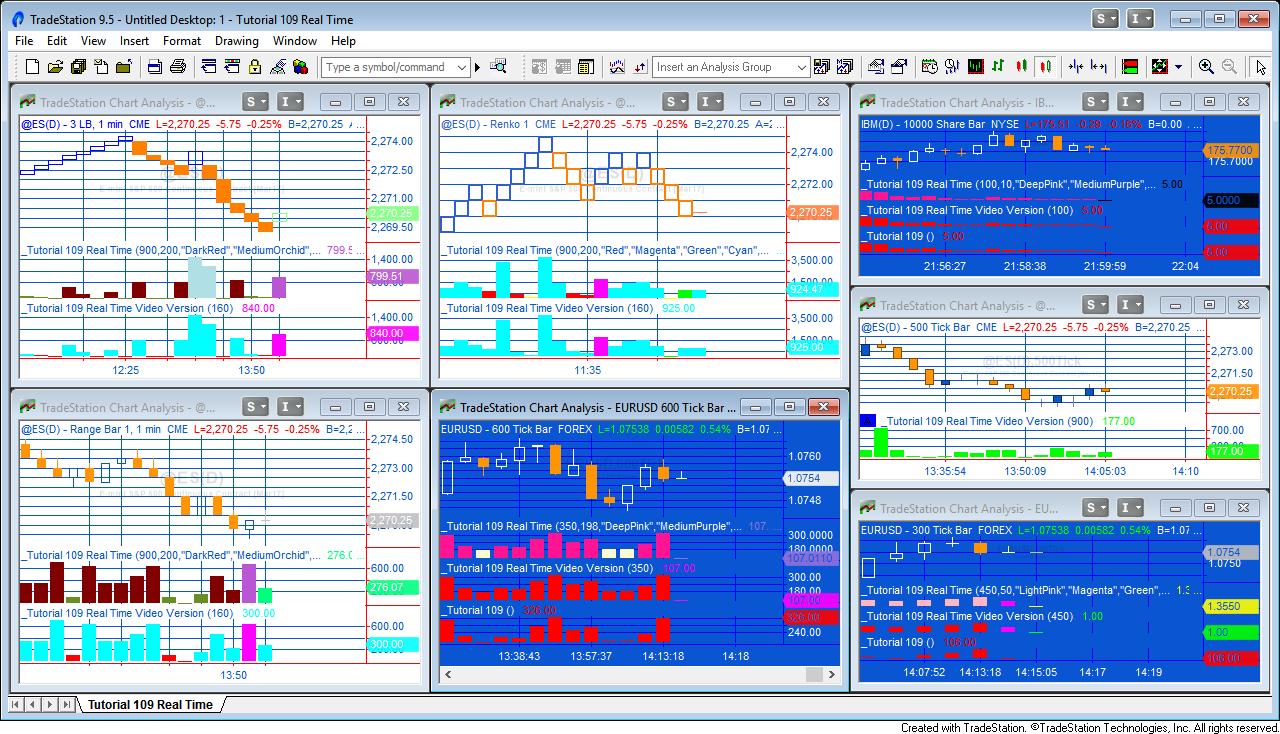
- _Tutorial 109 Real Time Video Version (described above)
- _Tutorial 109 Real Time (described below)
(The TradeStation EasyLanguage is fully functional and you can see the source code) are available for IMMEDIATE download for $24.95- by clicking the ‘add to cart’ button. After download the programs can be opened, you will be able to see the program code and modify it if you wish.
After purchase you will be redirected to a download page, so don’t close the browser.
_Tutorial 109 Real Time (improved version of the program described above)
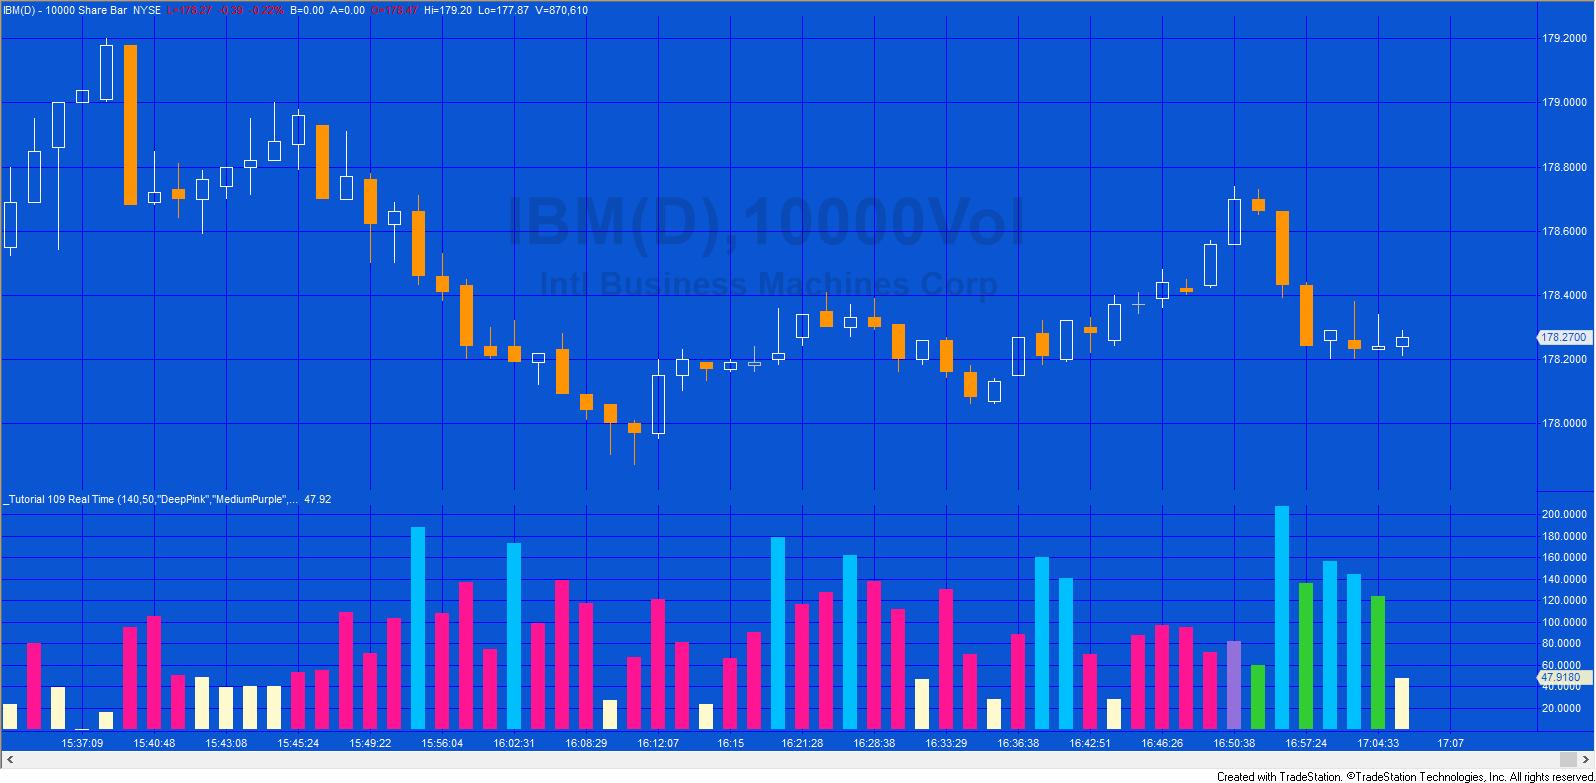
In addition to the program demonstrated in the video (named _Tutorial 109 Real Time Video Version), I have written another version (_Tutorial 109 Real Time). This version is completely rewritten and further enhances the concept by timing real time bars to millisecond accuracy. It also highlights bars where the time of a volume time histogram bar is less than a user input value and allows the bars to be colored according to user inputs.
Inputs for _Tutorial 109 Real Time
Inputs: int AlertDuration( 900 ), // If duration of bar is greater than this, issue alert and change color to ColorAlert color
int AlertDurationLo( 200 ), // If duration of bar is greater than this, issue alert and change color to ColorAlert color
// Histogram color options
string ColorHistoric( “Red” ), // The color of historic bars
string ColorFirst( “Magenta” ), // The color of a realtime bar that began historically
string ColorRealTime( “Green” ), // The color of real time bars
string ColorAlert( “Cyan” ), // For bars whose duration is greater than AlertDuration
string ColorAlertLo( “Yellow” ); // For bars whose duration is lower than AlertDuration
Notice that the colors are expressed as string values. This allows us to use the EasyLanguage color class (see list of possible colors below).
Video of Tutorial 109 Real Time (IMPROVED VERSION)
- _Tutorial 109 Real Time Video Version
- _Tutorial 109 Real Time
(The TradeStation EasyLanguage is fully functional and you can see the source code) are available for IMMEDIATE download for $24.95- by clicking the ‘add to cart’ button. After download the programs can be opened, you will be able to see the program code and modify it if you wish.
After purchase you will be redirected to a download page, so don’t close the browser.
Available colors
| AliceBlue | DarkSlateGray | LightSalmon | PaleVioletRed |
| AntiqueWhite | DarkTurquoise | LightSeaGreen | PapayaWhip |
| Aqua | DarkViolet | LightSkyBlue | PeachPuff |
| Aquamarine | DeepPink | LightSlateGray | Peru |
| Azure | DeepSkyBlue | LightSteelBlue | Pink |
| Beige | DimGray | LightYellow | Plum |
| Bisque | DodgerBlue | Lime | PowderBlue |
| Black | Firebrick | LimeGreen | Purple |
| BlanchedAlmond | FloralWhite | Linen | Red |
| Blue | ForestGreen | Magenta | RosyBrown |
| BlueViolet | Fuschia | Maroon | RoyalBlue |
| Brown | Gainsboro | MediumAquamarine | SaddleBrown |
| Burlywood | GhostWhite | MediumBlue | Salmon |
| CadetBlue | Gold | MediumOrchid | SandyBrown |
| Chartreuse | Goldenrod | MediumPurple | SeaGreen |
| Chocolate | Gray | MediumSeaGreen | Seashell |
| Coral | Green | MediumSlateBlue | Sienna |
| CornflowerBlue | GreenYellow | MediumSpringGreen | Silver |
| Cornsilk | Honeydew | MediumTurquoise | SkyBlue |
| Cyan | HotPink | MediumVioletRed | SlateBlue |
| DarkBlue | IndianRed | MidnightBlue | SlateGray |
| DarkBrown | Indigo | MintCream | Snow |
| DarkCyan | Ivory | MistyRose | SpringGreen |
| DarkGoldenrod | Khaki | Moccasin | SteelBlue |
| DarkGray | Lavender | NavajoWhite | Tan |
| DarkGreen | LavenderBlush | Navy | Teal |
| DarkKhaki | LawnGreen | OldLace | Thistle |
| Dark Magenta | LemonChiffon | Olive | Tomato |
| DarkOliveGreen | LightBlue | OliveDrab | Turquoise |
| DarkOrange | LightCoral | Orange | Violet |
| DarkOrchid | LightCyan | OrangeRed | Wheat |
| DarkRed | LightGoldenrodYellow | Orchid | White |
| DarkSalmon | LightGray | PaleGoldenrod | WhiteSmoke |
| DarkSeaGreen | LightGreen | PaleGreen | Yellow |
| DarkSlateBlue | LightPink | PaleTurquoise | YellowGreen |
THESE INDICATORS, SHOW ME STUDIES, STRATEGIES AND OTHER PROGRAMS HAVE BEEN INCLUDED SOLELY FOR EDUCATIONAL PURPOSES.
TO THE BEST OF MARKPLEX CORPORATION’S KNOWLEDGE, ALL OF THE INFORMATION ON THIS PAGE IS CORRECT, AND IT IS PROVIDED IN THE HOPE THAT IT WILL BE USEFUL. HOWEVER, MARKPLEX CORPORATION ASSUMES NO LIABILITY FOR ANY DAMAGES, DIRECT OR OTHERWISE, RESULTING FROM THE USE OF THIS INFORMATION AND/OR PROGRAM(S) DESCRIBED, AND NO WARRANTY IS MADE REGARDING ITS ACCURACY OR COMPLETENESS. USE OF THIS INFORMATION AND/OR PROGRAMS DESCRIBED IS AT YOUR OWN RISK.
ANY EASYLANGUAGE OR POWERLANGUAGE TRADING STRATEGIES, SIGNALS, STUDIES, INDICATORS, SHOWME STUDIES, PAINTBAR STUDIES, PROBABILITYMAP STUDIES, ACTIVITYBAR STUDIES, FUNCTIONS (AND PARTS THEREOF) AND ASSOCIATED TECHNIQUES REFERRED TO, INCLUDED IN OR ATTACHED TO THIS TUTORIAL OR PROGRAM DESCRIPTION ARE EXAMPLES ONLY, AND HAVE BEEN INCLUDED SOLELY FOR EDUCATIONAL PURPOSES. MARKPLEX CORPORATION. DOES NOT RECOMMEND THAT YOU USE ANY SUCH TRADING STRATEGIES, SIGNALS, STUDIES, INDICATORS, SHOWME STUDIES, PAINTBAR STUDIES, PROBABILITYMAP STUDIES, ACTIVITYBAR STUDIES, FUNCTIONS (OR ANY PARTS THEREOF) OR TECHNIQUES. THE USE OF ANY SUCH TRADING STRATEGIES, SIGNALS, STUDIES, INDICATORS, SHOWME STUDIES, PAINTBAR STUDIES, PROBABILITYMAP STUDIES, ACTIVITYBAR STUDIES, FUNCTIONS AND TECHNIQUES DOES NOT GUARANTEE THAT YOU WILL MAKE PROFITS, INCREASE PROFITS, OR MINIMIZE LOSSES.