
A basic TradeStation strategy tutorial
Welcome to tutorial 11 in this series of tutorials designed to introduce basic EasyLanguage concepts. In tutorials 10, I introduced PaintBar studies. PaintBar studies draw a line though an existing bar and are great for adding more information to a chart without the chart becoming too cluttered. By way of example, we created a demonstration Paintbar study to highlight pivots on a chart.
This tutorial introduces a simple strategy. Strategies can be designed to show where to get in and out of a position. They can be automated to actually place trades (with confirmation on or off). They are also useful for backtesting. The strategy introduced below SHOULD NOT be used to trade with. This tutorial is designed to help you with the ‘mechanics’ of creating your own strategy, rather than presenting a viable or usable strategy.
The strategy presented below is based on instigating trades at moving average crossovers. These trades can, at first glance, look profitable. In reality this technique may work well in trending markets but you can be badly ‘chopped around’ in non-trending markets. In addition, this strategy is designed to be in the market at all times and does not include provision for a stop-loss or profit target. I will be adding some of these refinements in the next few tutorials.
The program shown in this tutorial is available immediate download for only $14.95.
Gold Pass members get an additional 20% discount off all program and tutorial prices. If you are a Gold Pass member make sure you enter the special coupon code to get 20% discount off these prices. You can find the coupon code on the Gold Pass page.
Step 1
The first step in the process is to create a new EasyLanguage strategy by clicking File – New – Window, selecting the EasyLanguage tab and clicking ‘strategy’. Give the strategy a name and enter the program as below:
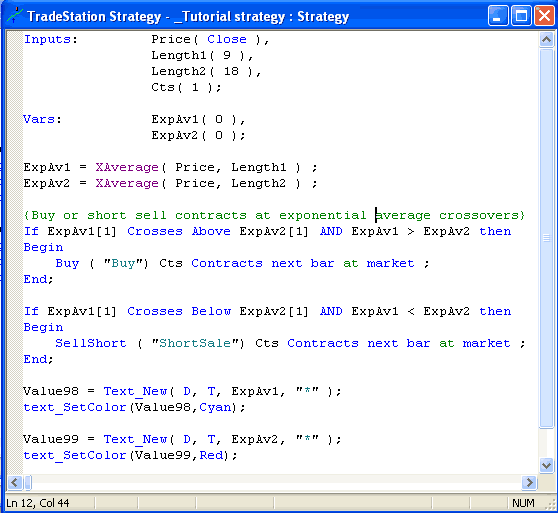
The program creates 2 variables: ExpAv1 and ExpAv2. These are set equal to the exponential moving average using the input values Length1 and Length2 respectively as their lengths. The program then looks for crossings one bar ago, checks that the exponential average is still above or below for the current bar and then instigates a buy or short sale.
- Buy,
- Sell,
- SellShort and
- BuyToCover.
Buy covers a short position and initiates a long position. Sell closes a long position. SellShort closes a long position and initiates a short position and BuyToCover covers a short position.
Step 2
So that we can see the Exponential Moving average on the chart (or at least an approximation of where it is), I have used the Text_New command to draw asterisks for the moving averages (you cannot use the Plot statement on strategies).
Having created the strategy and verified it, it is time to apply to a chart. Open a new chart and click Insert – Strategy and select the name of the strategy you have just created. You should see the following window:
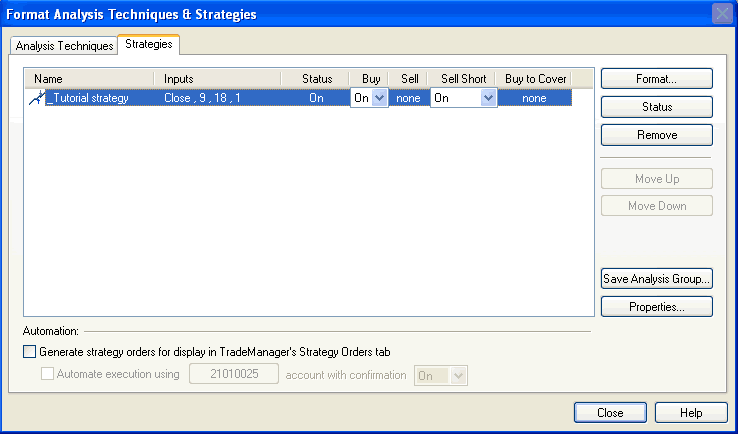
Make sure that that Automation is NOT selected, as it should be by default and click Close. Your chart should look something like the following:
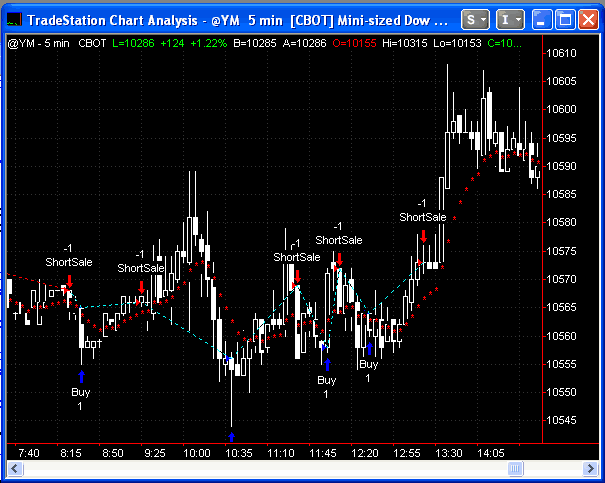
The arrow colors and dots joining trades are user definable.
Step 3
At this point we may realize that the strategy has severe limitations and it is time to reappraise it and maybe change some of the design concepts – perhaps by finding a way of avoiding trading in choppy markets. We would probably not use TradeStation’s optimization capability at this stage, however in order to demonstrate this capability we will now ‘optimize’ the strategy, as follows:
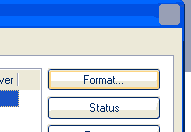
Click on the chart and then click Format – Strategies and then click the format button:
Step 4
You will then see the input screen:
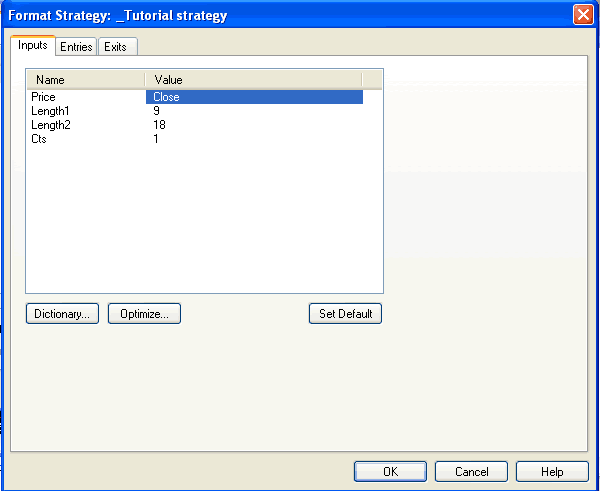
Click the number ‘9’ next to Length1 and then click the Optimize button:
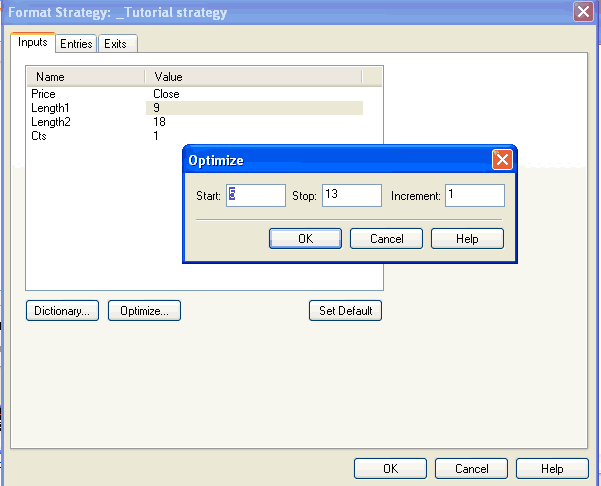
Enter the start, stop and increment values and then click OK
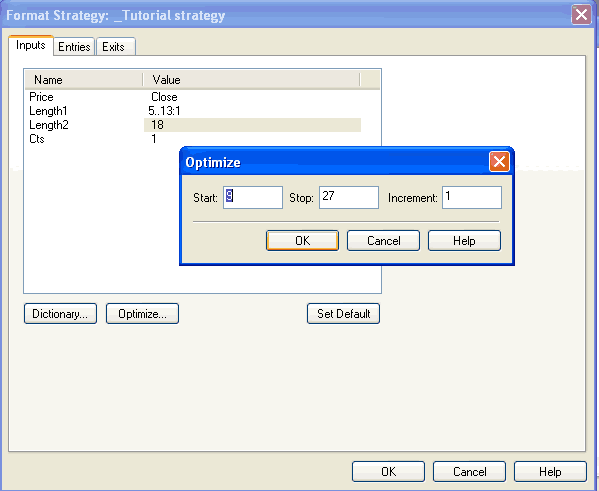
Do the same thing for the number 18 next to Length2:.
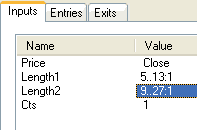
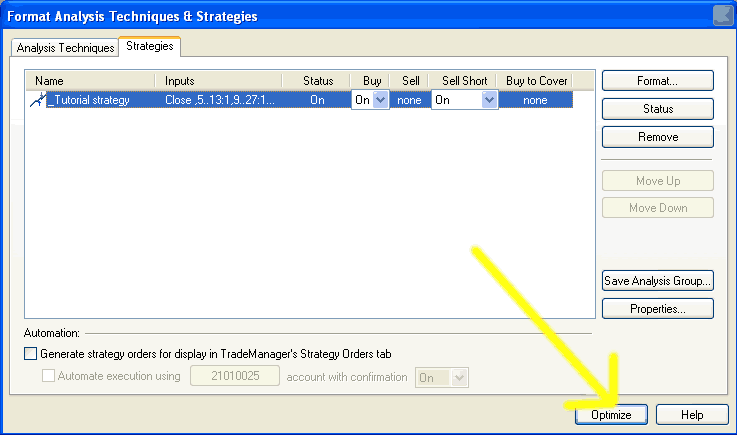
The format strategy screen should now look as follows:
Step 5
Click the optimize button.
and you should see the following screen:
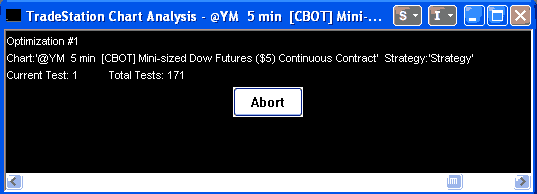
TradeStation works through all the different combinations of values to find the most profitable.
Step 6
After optimization there are two rich sources of information about this strategy. Make sure that you are in the chart windows and then click view. Click the Strategy Performance Report.
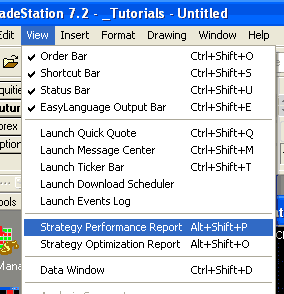
You should see the following window:
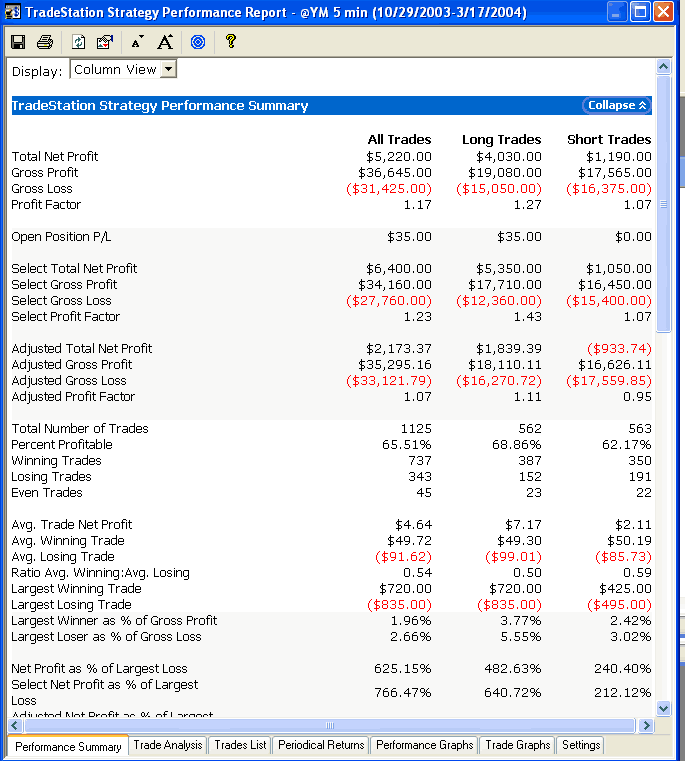
There is a wealth of information here about the strategy. Explore the different tabs at the bottom of the screen. Notice that the profit factor is only 1.17 – not particularly stellar – particularly as I have not taken into account commission or slippage!
Also, one of the dangers of optimization in TradeStation is the possibility that you can ‘over-optimize’ or ‘curve-fit’ your strategy and chart. By doing this it appears that you are making a good profit when in fact it just happens that your strategy fits this particular chart and timescale. This can be avoided by applying a strategy to different time scales, numbers of bars and symbols to test its validity.
The program shown in this tutorial is available immediate download for only $14.95.
Gold Pass members get an additional 20% discount off all program and tutorial prices. If you are a Gold Pass member make sure you enter the special coupon code to get 20% discount off these prices. You can find the coupon code on the Gold Pass page.
Summary
This tutorial demonstrates the creation of a very simple strategy. Obviously the strategy needs some work and so in the next few tutorials I will look at some of the ways in the which the strategy could be improved.
If you have any questions about the above material or you would like to point out a correction or typo, please e-mail: sales@markplex.com.
TO THE BEST OF MARKPLEX CORPORATION’S KNOWLEDGE, ALL OF THE INFORMATION ON THIS PAGE IS CORRECT, AND IT IS PROVIDED IN THE HOPE THAT IT WILL BE USEFUL. HOWEVER, MARKPLEX CORPORATION ASSUMES NO LIABILITY FOR ANY DAMAGES, DIRECT OR OTHERWISE, RESULTING FROM THE USE OF THIS INFORMATION AND/OR PROGRAM(S) DESCRIBED, AND NO WARRANTY IS MADE REGARDING ITS ACCURACY OR COMPLETENESS. USE OF THIS INFORMATION AND/OR PROGRAMS DESCRIBED IS AT YOUR OWN RISK.
ANY EASYLANGUAGE OR POWERLANGUAGE TRADING STRATEGIES, SIGNALS, STUDIES, INDICATORS, SHOWME STUDIES, PAINTBAR STUDIES, PROBABILITYMAP STUDIES, ACTIVITYBAR STUDIES, FUNCTIONS (AND PARTS THEREOF) AND ASSOCIATED TECHNIQUES REFERRED TO, INCLUDED IN OR ATTACHED TO THIS TUTORIAL OR PROGRAM DESCRIPTION ARE EXAMPLES ONLY, AND HAVE BEEN INCLUDED SOLELY FOR EDUCATIONAL PURPOSES. MARKPLEX CORPORATION. DOES NOT RECOMMEND THAT YOU USE ANY SUCH TRADING STRATEGIES, SIGNALS, STUDIES, INDICATORS, SHOWME STUDIES, PAINTBAR STUDIES, PROBABILITYMAP STUDIES, ACTIVITYBAR STUDIES, FUNCTIONS (OR ANY PARTS THEREOF) OR TECHNIQUES. THE USE OF ANY SUCH TRADING STRATEGIES, SIGNALS, STUDIES, INDICATORS, SHOWME STUDIES, PAINTBAR STUDIES, PROBABILITYMAP STUDIES, ACTIVITYBAR STUDIES, FUNCTIONS AND TECHNIQUES DOES NOT GUARANTEE THAT YOU WILL MAKE PROFITS, INCREASE PROFITS, OR MINIMIZE LOSSES.