
Use data from Excel spreadsheet in an EasyLanguage program
Tutorial 113 demonstrates how data stored in an Microsoft Excel spreadsheet may be used in a TradeStation EasyLanguage program applied to a chart. In tutorial 112, I demonstrated passing data from TradeStation to Excel. In tutorial 113 the data is flowing in the opposite direction.
The tutorial also demonstrates the use of the Drawing, ChartingHost and Timer objects as well as the use of methods.
The program is available for download for a small fee or for FREE to Gold Pass members.
What does the program do?
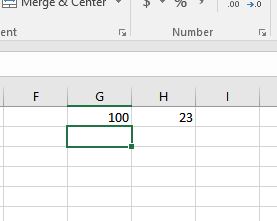
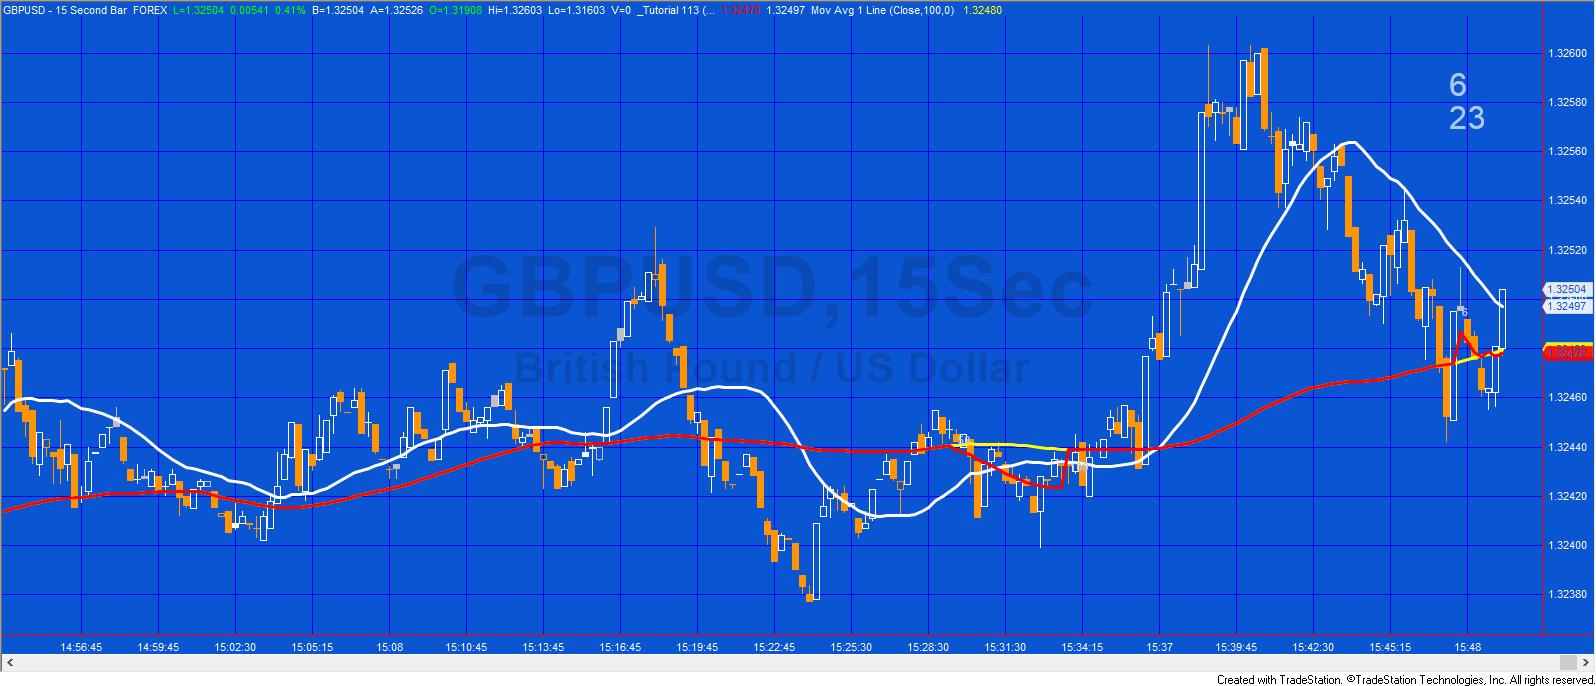
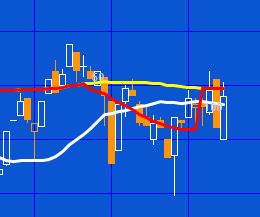
Tutorial 113 plots 2 moving averages. The lengths of the moving averages are determined by values stored in a spreadsheet in specific cells (G1 and H1). When the value in Excel cell G1 is changed, the program starts plotting an updated value for the moving average.
Tutorial 113 also creates text objects that display the current values of the parameters on the top right of the chart. These values are updated when the value in G1 is changed on on each new recalculation of the program. These text objects are re-positioned if the size of the chart window is changed. An additional text object is added to the chart on the current bar whenever the value of G1 is changed. This object remains with the bar where it is originally positioned.
EasyLanguage technical lessons
In the tutorial video and the program comments you will learn:
- How to use the Workbook class
- How to use the Timer
- How to use the ChartingHost object
- How to create methods
- The use of an intrabarpersist variable
Although I do not use it in the demonstration video, the objects and their associated events can be created using the toolbox. The resulting code can be copied from Designer Generated Code, into the TradeStation Development Environment.
Version: 9.5 (Update 15). I had major problems with update 14 running under Windows 10 (totally unrelated to this tutorial), with TradeStation continually crashing whenever I tried to open a workspace or to create a chart.
Inputs
Tutorial 113 has a single input that tells the program where the Excel spreadsheet is located.
FileName( “C:\Program Files (x86)\TradeStation 9.5\MyWork\tutorial113.xlsx” );
Make sure you have an Excel file in this location.
Free download for Gold Pass members
Tutorial 113 download
Tutorial 113 is available for IMMEDIATE download for $19.95 by clicking the ‘add to cart’ button.
After download the programs can be opened, you will be able to see the program code and modify it if you wish.
After purchase you will be redirected to a download page, so don’t close the browser.
The download ELD includes _Tutorial 113 an EasyLanguage indicator.
Note: The program name begin with an underscore, so it will be towards the start of the list if you sort alphabetically.
Tutorial 113 was developed for TradeStation 9.5 update 15 and will not work with MultiCharts.
Video demonstration of tutorial 113
If you notice any errors or have comments or questions about the tutorial, please email me.
THESE INDICATORS, SHOW ME STUDIES, STRATEGIES AND OTHER PROGRAMS HAVE BEEN INCLUDED SOLELY FOR EDUCATIONAL PURPOSES.
TO THE BEST OF MARKPLEX CORPORATION’S KNOWLEDGE, ALL OF THE INFORMATION ON THIS PAGE IS CORRECT, AND IT IS PROVIDED IN THE HOPE THAT IT WILL BE USEFUL. HOWEVER, MARKPLEX CORPORATION ASSUMES NO LIABILITY FOR ANY DAMAGES, DIRECT OR OTHERWISE, RESULTING FROM THE USE OF THIS INFORMATION AND/OR PROGRAM(S) DESCRIBED, AND NO WARRANTY IS MADE REGARDING ITS ACCURACY OR COMPLETENESS. USE OF THIS INFORMATION AND/OR PROGRAMS DESCRIBED IS AT YOUR OWN RISK.
ANY EASYLANGUAGE OR POWERLANGUAGE TRADING STRATEGIES, SIGNALS, STUDIES, INDICATORS, SHOWME STUDIES, PAINTBAR STUDIES, PROBABILITYMAP STUDIES, ACTIVITYBAR STUDIES, FUNCTIONS (AND PARTS THEREOF) AND ASSOCIATED TECHNIQUES REFERRED TO, INCLUDED IN OR ATTACHED TO THIS TUTORIAL OR PROGRAM DESCRIPTION ARE EXAMPLES ONLY, AND HAVE BEEN INCLUDED SOLELY FOR EDUCATIONAL PURPOSES. MARKPLEX CORPORATION. DOES NOT RECOMMEND THAT YOU USE ANY SUCH TRADING STRATEGIES, SIGNALS, STUDIES, INDICATORS, SHOWME STUDIES, PAINTBAR STUDIES, PROBABILITYMAP STUDIES, ACTIVITYBAR STUDIES, FUNCTIONS (OR ANY PARTS THEREOF) OR TECHNIQUES. THE USE OF ANY SUCH TRADING STRATEGIES, SIGNALS, STUDIES, INDICATORS, SHOWME STUDIES, PAINTBAR STUDIES, PROBABILITYMAP STUDIES, ACTIVITYBAR STUDIES, FUNCTIONS AND TECHNIQUES DOES NOT GUARANTEE THAT YOU WILL MAKE PROFITS, INCREASE PROFITS, OR MINIMIZE LOSSES.