
Draw rectangular zones on a chart using input data
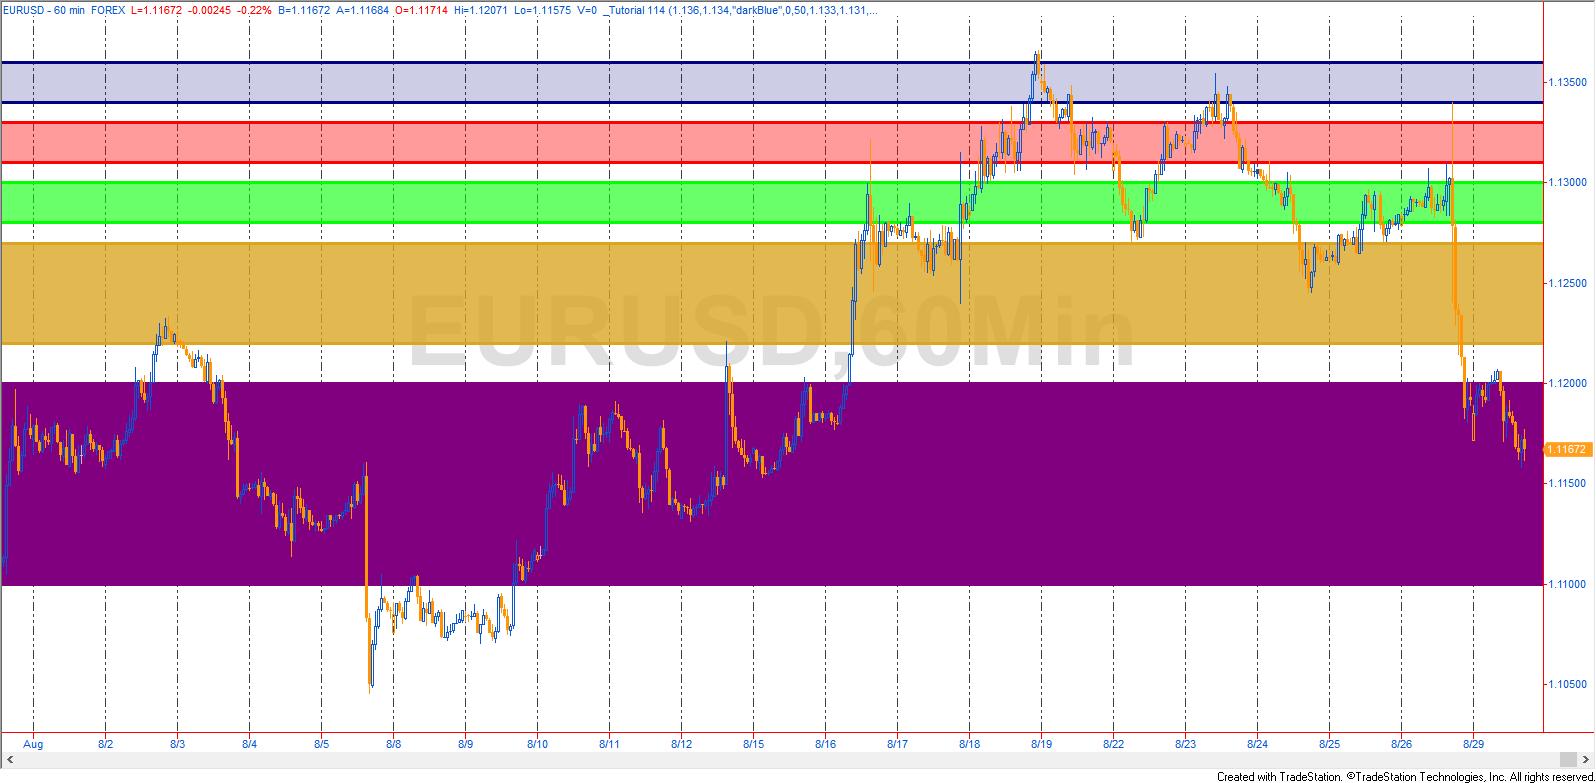
Tutorial 114 demonstrates how to use the rectangular drawing tool to draw colored zones on a chart. The tutorial demonstrates how easy it is to draw and style rectangles using TradeStation 9.5 drawing objects. The tutorial is in response to a customer request.
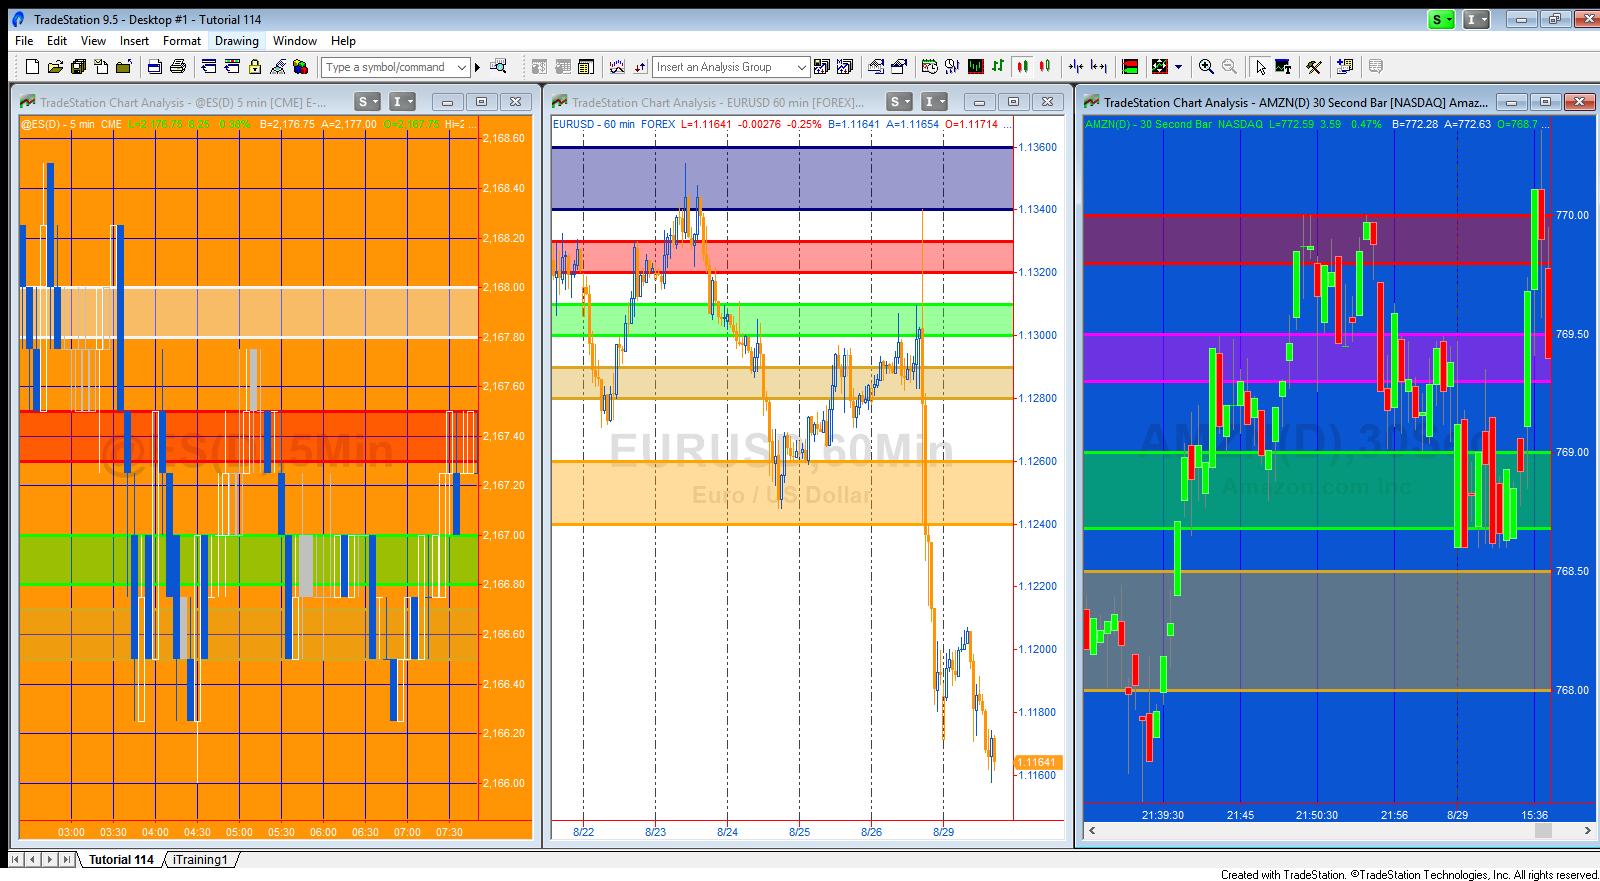
The tutorial program use BN points to set the start and end points of the rectangles. The rectangle class is used together with several of its properties and the create class. The tutorial uses a method to create the rectangles, which is called from several places in the program. Tutorial 114 can create 5 rectangles.
The tutorial has been kept intentionally simple.
The program is available for download for a small cost or for FREE to Gold Pass members.
EasyLanguage technical lessons
In the tutorial video and the program comments you will learn:
- How to write a method with several inputs
- How to use the Rectangle class
- How to create a BN (Bar Number) point
- How to extend the rectangles to the right
- How to vary the transparency of the rectangles
Version: 9.5 (Update 15). I had major problems with update 14 running under Windows 10 (totally unrelated to this tutorial), with TradeStation continually crashing whenever I tried to open a workspace or to create a chart.
Inputs
double Zone1_Hi( 2168), // The price level of the upper edge of the rectangle for the first rectangle
double Zone1_Lo( 2167.8), // The price level of the lower edge of the rectangle for the first rectangle
string Zone1_Color( “Blue”), // The color of the first rectangle
int Zone1_Shading( 0), // The shading pattern of the first rectangle
int Zone1_Transparency( 100), // The alpha value of the first rectangle (between 0 and 255)
double Zone2_Hi( 2167.5),
double Zone2_Lo( 2167.3),
string Zone2_Color( “Red”),
int Zone2_Shading( 0),
int Zone2_Transparency( 100),
double Zone3_Hi( 2167),
double Zone3_Lo( 2166.8),
string Zone3_Color( “Green”),
int Zone3_Shading( 0),
int Zone3_Transparency( 100),
double Zone4_Hi( 2166.7),
double Zone4_Lo( 2166.5),
string Zone4_Color( “Goldenrod”),
int Zone4_Shading( 0),
int Zone4_Transparency( 100),
double Zone5_Hi( 1800),
double Zone5_Lo( 1700),
string Zone5_Color( “Ivory”),
int Zone5_Shading( 0),
int Zone5_Transparency( 100);
Code for Gold Pass members
Gold Pass members may copy and paste the following code:![]() This content is for members only.
This content is for members only.
Tutorial 114 download
The download ELD includes _Tutorial 114 an EasyLanguage show me study.
Note: The program name begin with an underscore, so it will be towards the start of the list if you sort alphabetically.
Tutorial 114 was developed for TradeStation 9.5 update 15 and will not work with MultiCharts.
Video demonstration of tutorial 114
If you notice any errors or have comments or questions about the tutorial, please email me.
THESE INDICATORS, SHOW ME STUDIES, STRATEGIES AND OTHER PROGRAMS HAVE BEEN INCLUDED SOLELY FOR EDUCATIONAL PURPOSES.
TO THE BEST OF MARKPLEX CORPORATION’S KNOWLEDGE, ALL OF THE INFORMATION ON THIS PAGE IS CORRECT, AND IT IS PROVIDED IN THE HOPE THAT IT WILL BE USEFUL. HOWEVER, MARKPLEX CORPORATION ASSUMES NO LIABILITY FOR ANY DAMAGES, DIRECT OR OTHERWISE, RESULTING FROM THE USE OF THIS INFORMATION AND/OR PROGRAM(S) DESCRIBED, AND NO WARRANTY IS MADE REGARDING ITS ACCURACY OR COMPLETENESS. USE OF THIS INFORMATION AND/OR PROGRAMS DESCRIBED IS AT YOUR OWN RISK.
ANY EASYLANGUAGE OR POWERLANGUAGE TRADING STRATEGIES, SIGNALS, STUDIES, INDICATORS, SHOWME STUDIES, PAINTBAR STUDIES, PROBABILITYMAP STUDIES, ACTIVITYBAR STUDIES, FUNCTIONS (AND PARTS THEREOF) AND ASSOCIATED TECHNIQUES REFERRED TO, INCLUDED IN OR ATTACHED TO THIS TUTORIAL OR PROGRAM DESCRIPTION ARE EXAMPLES ONLY, AND HAVE BEEN INCLUDED SOLELY FOR EDUCATIONAL PURPOSES. MARKPLEX CORPORATION. DOES NOT RECOMMEND THAT YOU USE ANY SUCH TRADING STRATEGIES, SIGNALS, STUDIES, INDICATORS, SHOWME STUDIES, PAINTBAR STUDIES, PROBABILITYMAP STUDIES, ACTIVITYBAR STUDIES, FUNCTIONS (OR ANY PARTS THEREOF) OR TECHNIQUES. THE USE OF ANY SUCH TRADING STRATEGIES, SIGNALS, STUDIES, INDICATORS, SHOWME STUDIES, PAINTBAR STUDIES, PROBABILITYMAP STUDIES, ACTIVITYBAR STUDIES, FUNCTIONS AND TECHNIQUES DOES NOT GUARANTEE THAT YOU WILL MAKE PROFITS, INCREASE PROFITS, OR MINIMIZE LOSSES.