
Daily Average True Range (ATR) calculated on an intraday chart
TradeStation have a standard indicator for plotting the ATR which uses the data for the chart for which it is applied. However, what if you wished to calculate the ATR of daily bars and plot it on a 5 minute chart? It would be relatively straightforward to use data from the current chart, however this tutorial explains how to do the calculation using the price series provider (PSP) class. This has several advantages including using settlement prices and the ability to be easily modified to allow a different symbol or bar length to be used.
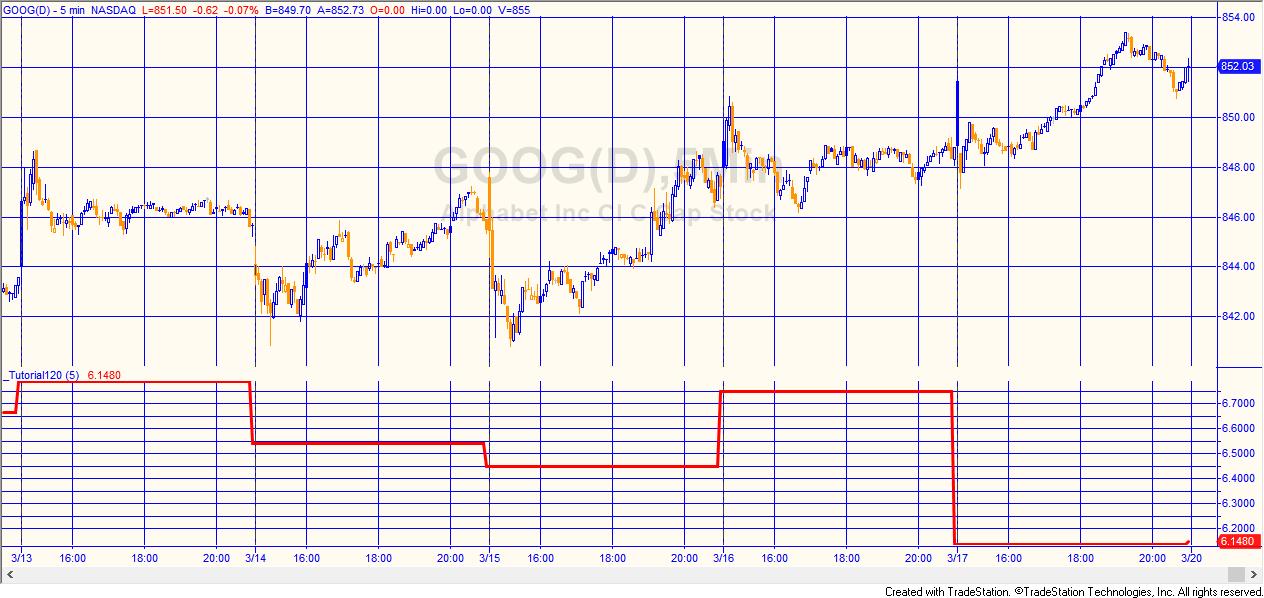
The following screen shot shows the tutorial applied to a 5 minute Google chart.
The Average True Range (ATR) is a measure of volatility originally developed by J. Welles Wilder and is featured in his book: New Concepts in Technical Trading Systems.
Calculation
The true range (TR) for each bar is calculated. This is the difference between the ‘true high’ and the ‘true low.’ The ‘true high’ is the greater of this bar’s high and the last bar’s close. The ‘true low’ is the lesser of this bar’s low and the last bar’s close. The ATR is the simple average of the true range values.
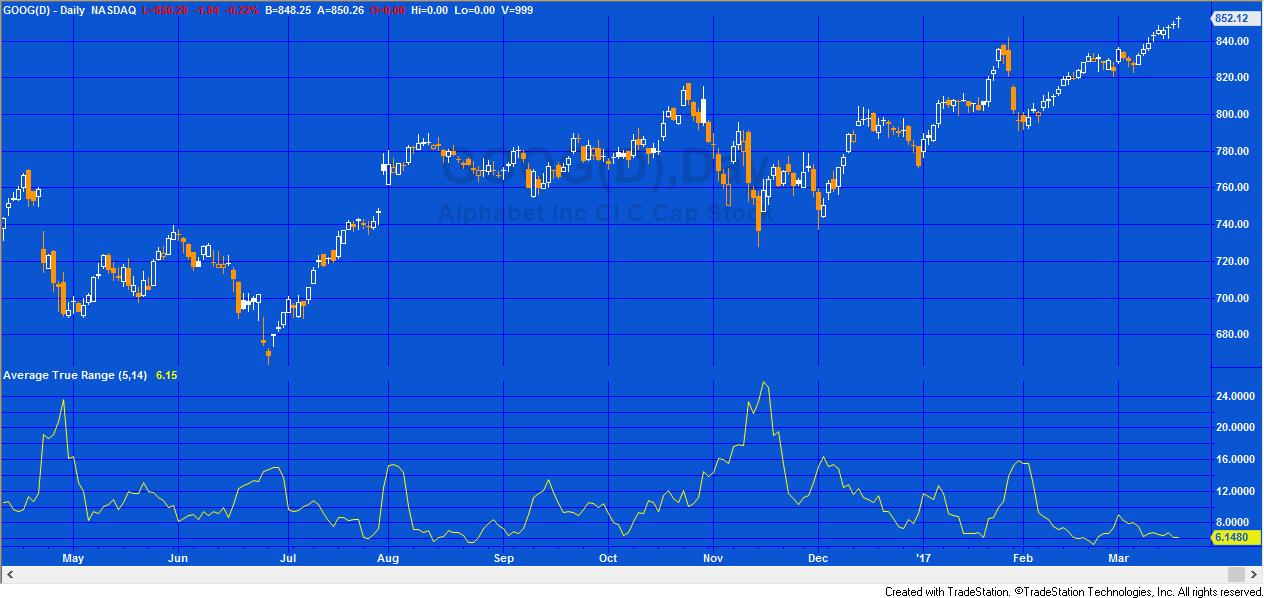
The following screen shot is of the regular TradeStation Average True Range indicator applied to a daily Google chart.
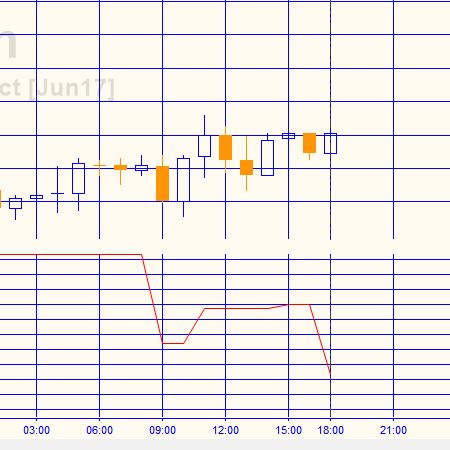
The indicator calculates all the historic bars and then begins real time updates for the ‘real-time’ bars, i.e. the once that have developed since the program was activated or applied to the chart. For indicators, showme studies and paintbar studies the program runs once per bar for historic bars. For real time bars, it runs every tick.
This real time update can be seen on this chart.
Notice that at 15:00 the horizontal line adjusts upward.
The code is available free to Gold Pass members (see below).
After download the programs can be opened, you will be able to see the program code and modify it if you wish.
The current version (0.1.1) has been modified slightly from the original to use a once statement rather than an initializecomponent statement. It also now works with RadarScreen.
After purchase you will be redirected to a download page, so don’t close the browser.
Programming lessons
The downloadable version of tutorial 120 is commented within the program and demonstrate various useful programming techniques and constructs, including:
- Easily creating a price series provider using TradeStation’s component tray functionality
- Avoid errors caused by attempting to use PSP data that does not exist
- Automatically select exchange or local time for the indicator based on the chart setting
- Load sufficient data
- Why the program sometimes runs once and then re-runs
- How to create an update event for the PSP
Video explanation of tutorial 120 | Part 1
Video explanation of tutorial 120 | Part 2
Gold Pass area
The code is available free to Gold Pass members (see above).
After download the programs can be opened, you will be able to see the program code and modify it if you wish.
After purchase you will be redirected to a download page, so don’t close the browser.
THESE INDICATORS, SHOW ME STUDIES, STRATEGIES AND OTHER PROGRAMS HAVE BEEN INCLUDED SOLELY FOR EDUCATIONAL PURPOSES.
TO THE BEST OF MARKPLEX CORPORATION’S KNOWLEDGE, ALL OF THE INFORMATION ON THIS PAGE IS CORRECT, AND IT IS PROVIDED IN THE HOPE THAT IT WILL BE USEFUL. HOWEVER, MARKPLEX CORPORATION ASSUMES NO LIABILITY FOR ANY DAMAGES, DIRECT OR OTHERWISE, RESULTING FROM THE USE OF THIS INFORMATION AND/OR PROGRAM(S) DESCRIBED, AND NO WARRANTY IS MADE REGARDING ITS ACCURACY OR COMPLETENESS. USE OF THIS INFORMATION AND/OR PROGRAMS DESCRIBED IS AT YOUR OWN RISK.
ANY EASYLANGUAGE OR POWERLANGUAGE TRADING STRATEGIES, SIGNALS, STUDIES, INDICATORS, SHOWME STUDIES, PAINTBAR STUDIES, PROBABILITYMAP STUDIES, ACTIVITYBAR STUDIES, FUNCTIONS (AND PARTS THEREOF) AND ASSOCIATED TECHNIQUES REFERRED TO, INCLUDED IN OR ATTACHED TO THIS TUTORIAL OR PROGRAM DESCRIPTION ARE EXAMPLES ONLY, AND HAVE BEEN INCLUDED SOLELY FOR EDUCATIONAL PURPOSES. MARKPLEX CORPORATION. DOES NOT RECOMMEND THAT YOU USE ANY SUCH TRADING STRATEGIES, SIGNALS, STUDIES, INDICATORS, SHOWME STUDIES, PAINTBAR STUDIES, PROBABILITYMAP STUDIES, ACTIVITYBAR STUDIES, FUNCTIONS (OR ANY PARTS THEREOF) OR TECHNIQUES. THE USE OF ANY SUCH TRADING STRATEGIES, SIGNALS, STUDIES, INDICATORS, SHOWME STUDIES, PAINTBAR STUDIES, PROBABILITYMAP STUDIES, ACTIVITYBAR STUDIES, FUNCTIONS AND TECHNIQUES DOES NOT GUARANTEE THAT YOU WILL MAKE PROFITS, INCREASE PROFITS, OR MINIMIZE LOSSES.