
Improving the responsiveness of exponential moving averages when price gaps
Tutorial 127 explains techniques for modifying the exponential moving average (EMA) calculation to account for price gaps. The tutorial explains an approach for a simple EMA applied to a regular chart (tutorial program _EMA_Gap) and also the more complex situation when calculating the EMA of a price series provider (PSP) (N.B. PSP functionality is not available in MultiCharts.
The tutorial uses some of the same code as tutorial 86, however I have modified it significantly to take gaps into account. It would still be worth looking at tutorial 86 as background.
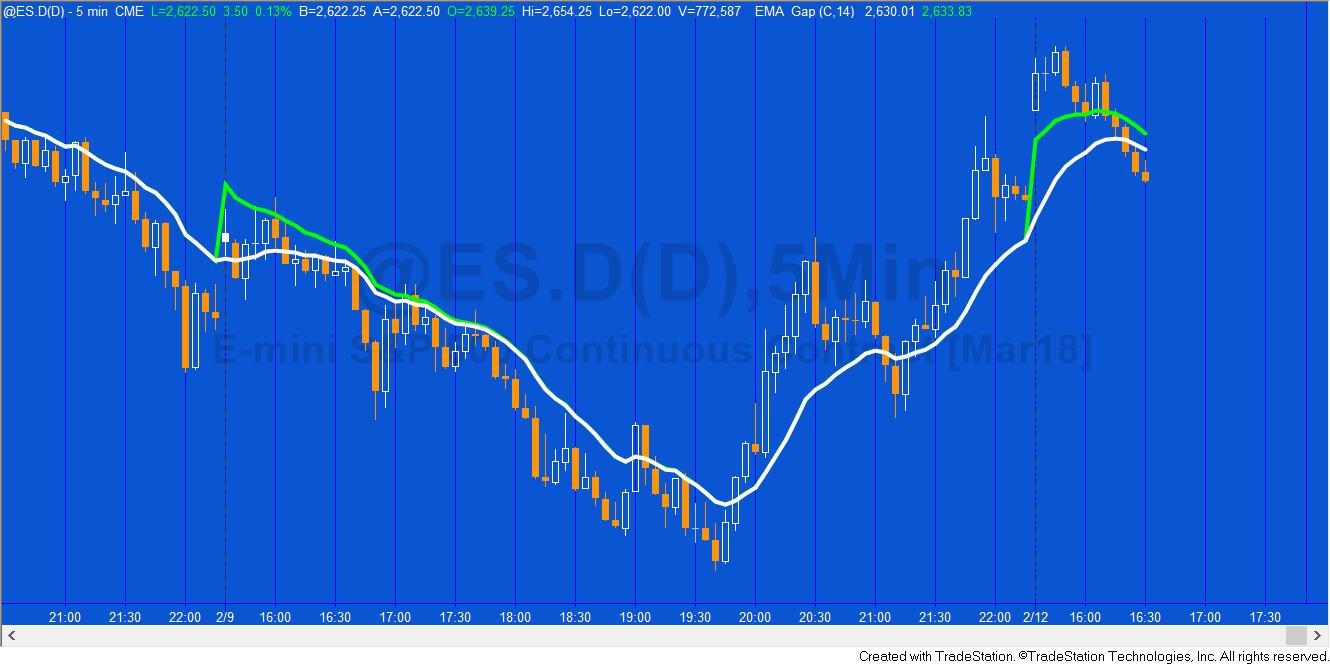
The image above shows a standard EMA in white and the one adjusted for gaps in green. Notice that the two EMAs converge during the day.
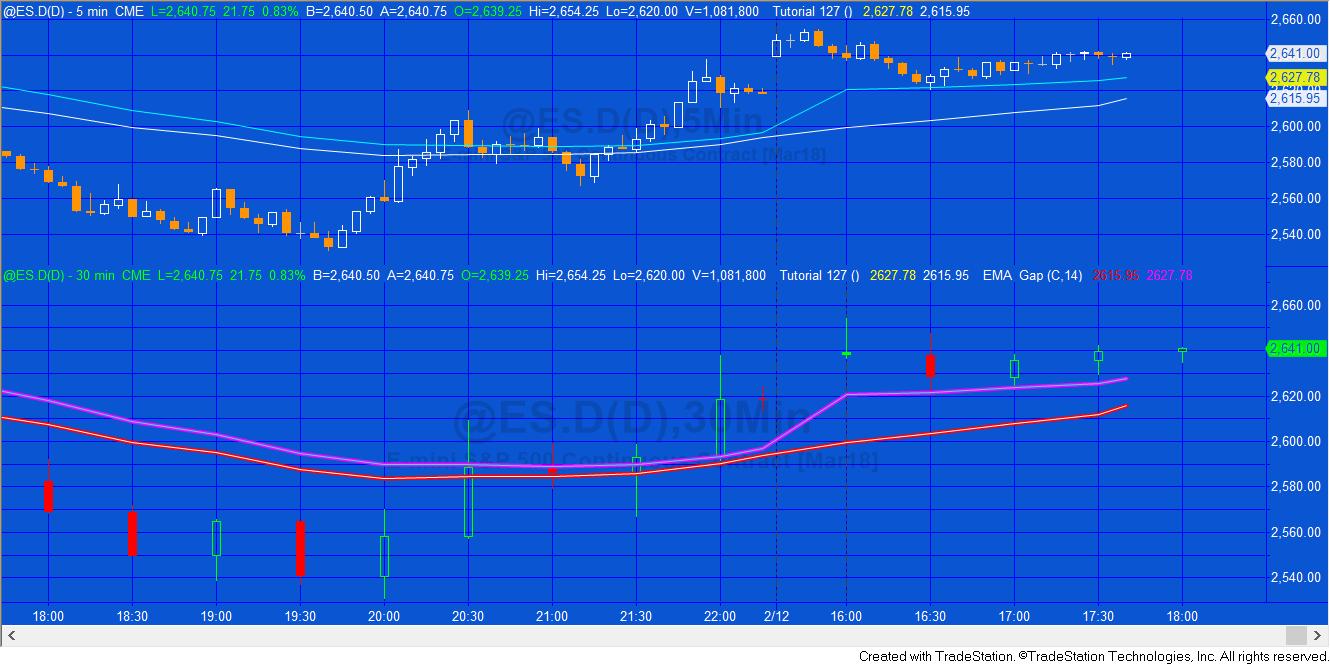
The above image shows a far more complex situation where both a ‘simple’ gap-adjusted EMA is calculated and plotted together with a far more complex PSP gap-adjusted calculation, i.e. rather than calculate the gap adjusted EMA based on the 30 minute bar data in data 2, the program calculates the equivalent EMA using a PSP when it is applied to 5 minute bars.
What’s the point of using a Price Series Provider when you have data 2 loaded?
I utilized data 2 in the tutorial to demonstrate that the calculation from the simple EMA applied to data2 is the same as the calculation by the program using the smaller time frame in data1. _Tutorial127 does reference data2 BUT only to find the bar duration. This could easily be modified.

Gold Pass members can download _EMA_Gap for free. Go the the Gold Pass area below. To see all the programs and tutorials pages that contain some Gold Pass content click here.
Programming lessons in _Tutorial127
The tutorial demonstrates how to:
- Utilize a price series provider
- Calculate an EMA with a PSP on a lower time frame chart
- Ensure that the EMA is updated, only when a PSP close update event occurs
- Modify the EMA calculation to adjust for a price gap after a new session begins.
- For a simple calculation
- For a PSP calculation
- To different calculations for real time and historic bars when using the PSP
How _Tutorial127 works
See the video and notes below for more information.
Program instantiates a PSP using the time interval of data 2. It detects whether the symbols are set to local or exchange time and sets the PSP time to the same. It loads data going back to the datetime of the first bar of the chart and creates an update event.
The update event detects when the close of the PSP bar occurs.
On the first bar of the chart the normal EMA and the one that takes account of gaps are set to close.
The program detects when the session number changes and measures the value of the gap (if any).
For non-real time bars
For historic bars the program calculates a normal EMA and one that takes account of gaps. This is calculated on each bar but the equivalent of the EMA last bar is only set when a new PSP bar begins to form as determined by a change of the bar time. This is done by setting
TimeLast = PSP.Time[0];
within the subroutine and then checking when PSP.Time[0] (the time of the PSP) is different.
For real-time bars
The real time formulae are the same only now we wait for a close update event of the PSP. At the next real time tick after this the equivalent of the EMA last bar is set.
Tutorial 127 assumes that the EMA is calculated on the close.
Download _Tutorial127
[download_box]The UNPROTECTED TradeStation indicators ( _Tutorial127 and _EMA_Gap) are available for IMMEDIATE download for $29.95- by clicking the ‘add to cart’ button.
After purchase you will be redirected to a download page, so don’t close the browser.
[/download_box]
Gold Pass area
Gold pass members, make sure that you are logged in to download _EMA_Gap for free.
![]() This content is for members only.
This content is for members only.
Video explanation of _Tutorial127
Tutorial 127 | Video Part 2
A Gold Pass member asked how to remove the reference to data 2 from tutorial 127. In this second video I explain this.
Please let me know if you spot any bugs or errors or have questions.
THESE INDICATORS, SHOW ME STUDIES, STRATEGIES AND OTHER PROGRAMS HAVE BEEN INCLUDED SOLELY FOR EDUCATIONAL PURPOSES.
TO THE BEST OF MARKPLEX CORPORATION’S KNOWLEDGE, ALL OF THE INFORMATION ON THIS PAGE IS CORRECT, AND IT IS PROVIDED IN THE HOPE THAT IT WILL BE USEFUL. HOWEVER, MARKPLEX CORPORATION ASSUMES NO LIABILITY FOR ANY DAMAGES, DIRECT OR OTHERWISE, RESULTING FROM THE USE OF THIS INFORMATION AND/OR PROGRAM(S) DESCRIBED, AND NO WARRANTY IS MADE REGARDING ITS ACCURACY OR COMPLETENESS. USE OF THIS INFORMATION AND/OR PROGRAMS DESCRIBED IS AT YOUR OWN RISK.
ANY EASYLANGUAGE OR POWERLANGUAGE TRADING STRATEGIES, SIGNALS, STUDIES, INDICATORS, SHOWME STUDIES, PAINTBAR STUDIES, PROBABILITYMAP STUDIES, ACTIVITYBAR STUDIES, FUNCTIONS (AND PARTS THEREOF) AND ASSOCIATED TECHNIQUES REFERRED TO, INCLUDED IN OR ATTACHED TO THIS TUTORIAL OR PROGRAM DESCRIPTION ARE EXAMPLES ONLY, AND HAVE BEEN INCLUDED SOLELY FOR EDUCATIONAL PURPOSES. MARKPLEX CORPORATION. DOES NOT RECOMMEND THAT YOU USE ANY SUCH TRADING STRATEGIES, SIGNALS, STUDIES, INDICATORS, SHOWME STUDIES, PAINTBAR STUDIES, PROBABILITYMAP STUDIES, ACTIVITYBAR STUDIES, FUNCTIONS (OR ANY PARTS THEREOF) OR TECHNIQUES. THE USE OF ANY SUCH TRADING STRATEGIES, SIGNALS, STUDIES, INDICATORS, SHOWME STUDIES, PAINTBAR STUDIES, PROBABILITYMAP STUDIES, ACTIVITYBAR STUDIES, FUNCTIONS AND TECHNIQUES DOES NOT GUARANTEE THAT YOU WILL MAKE PROFITS, INCREASE PROFITS, OR MINIMIZE LOSSES.