
Using the a Price Series Provider to calculate RSI
It is sometimes useful to calculate the RSI for a time frame different from that of the symbol applied as Data 1, i.e. say you had a five minute chart but wanted to see what the RSI would be on a 60 minute chart. You could use additional data streams (data2, data3 etc) but this might not be convenient or possible. For example, if you use data2 then you could no longer use Intrabarordergeneration and it is not possible to use data2 with a tick, volume or advanced data chart.
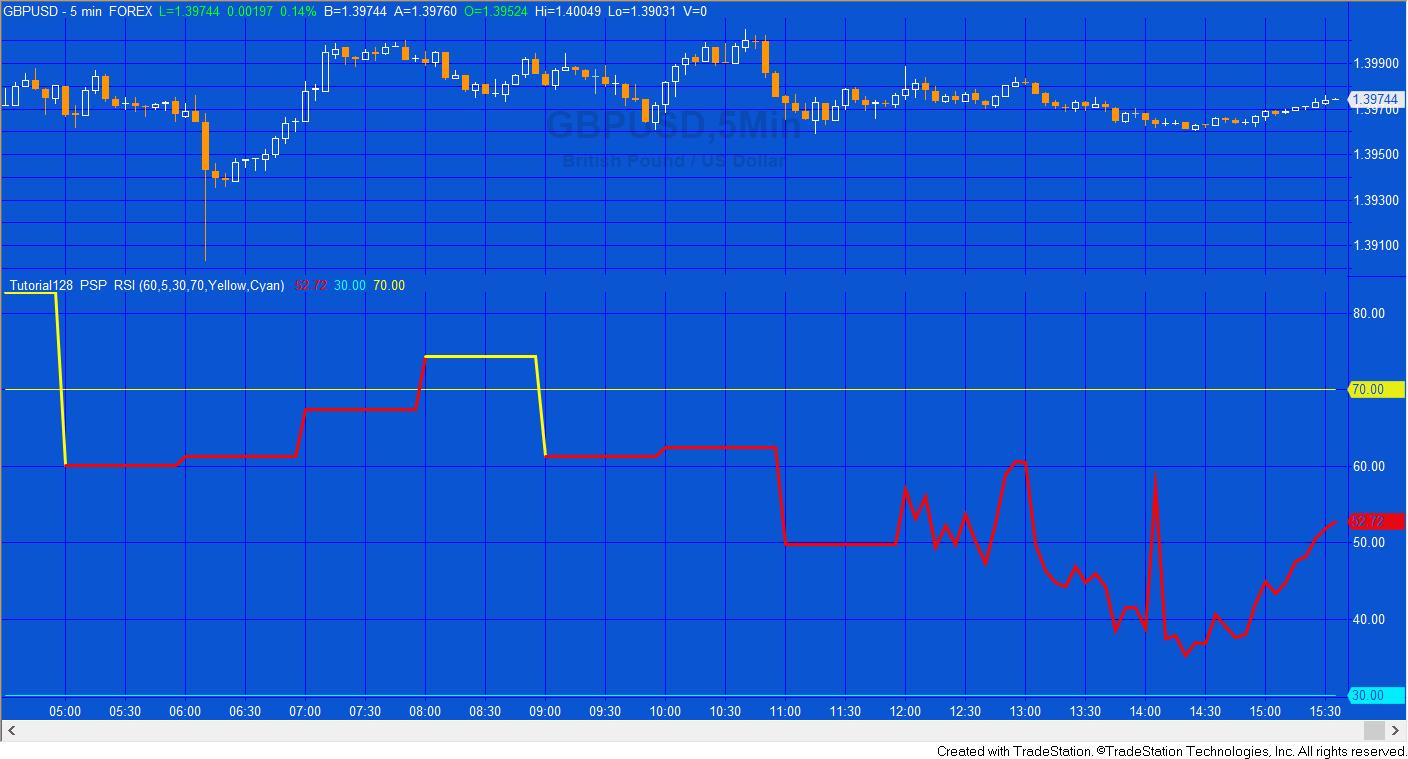
One solution is to use a Price Series Provider (PSP) as demonstrated in this tutorial.
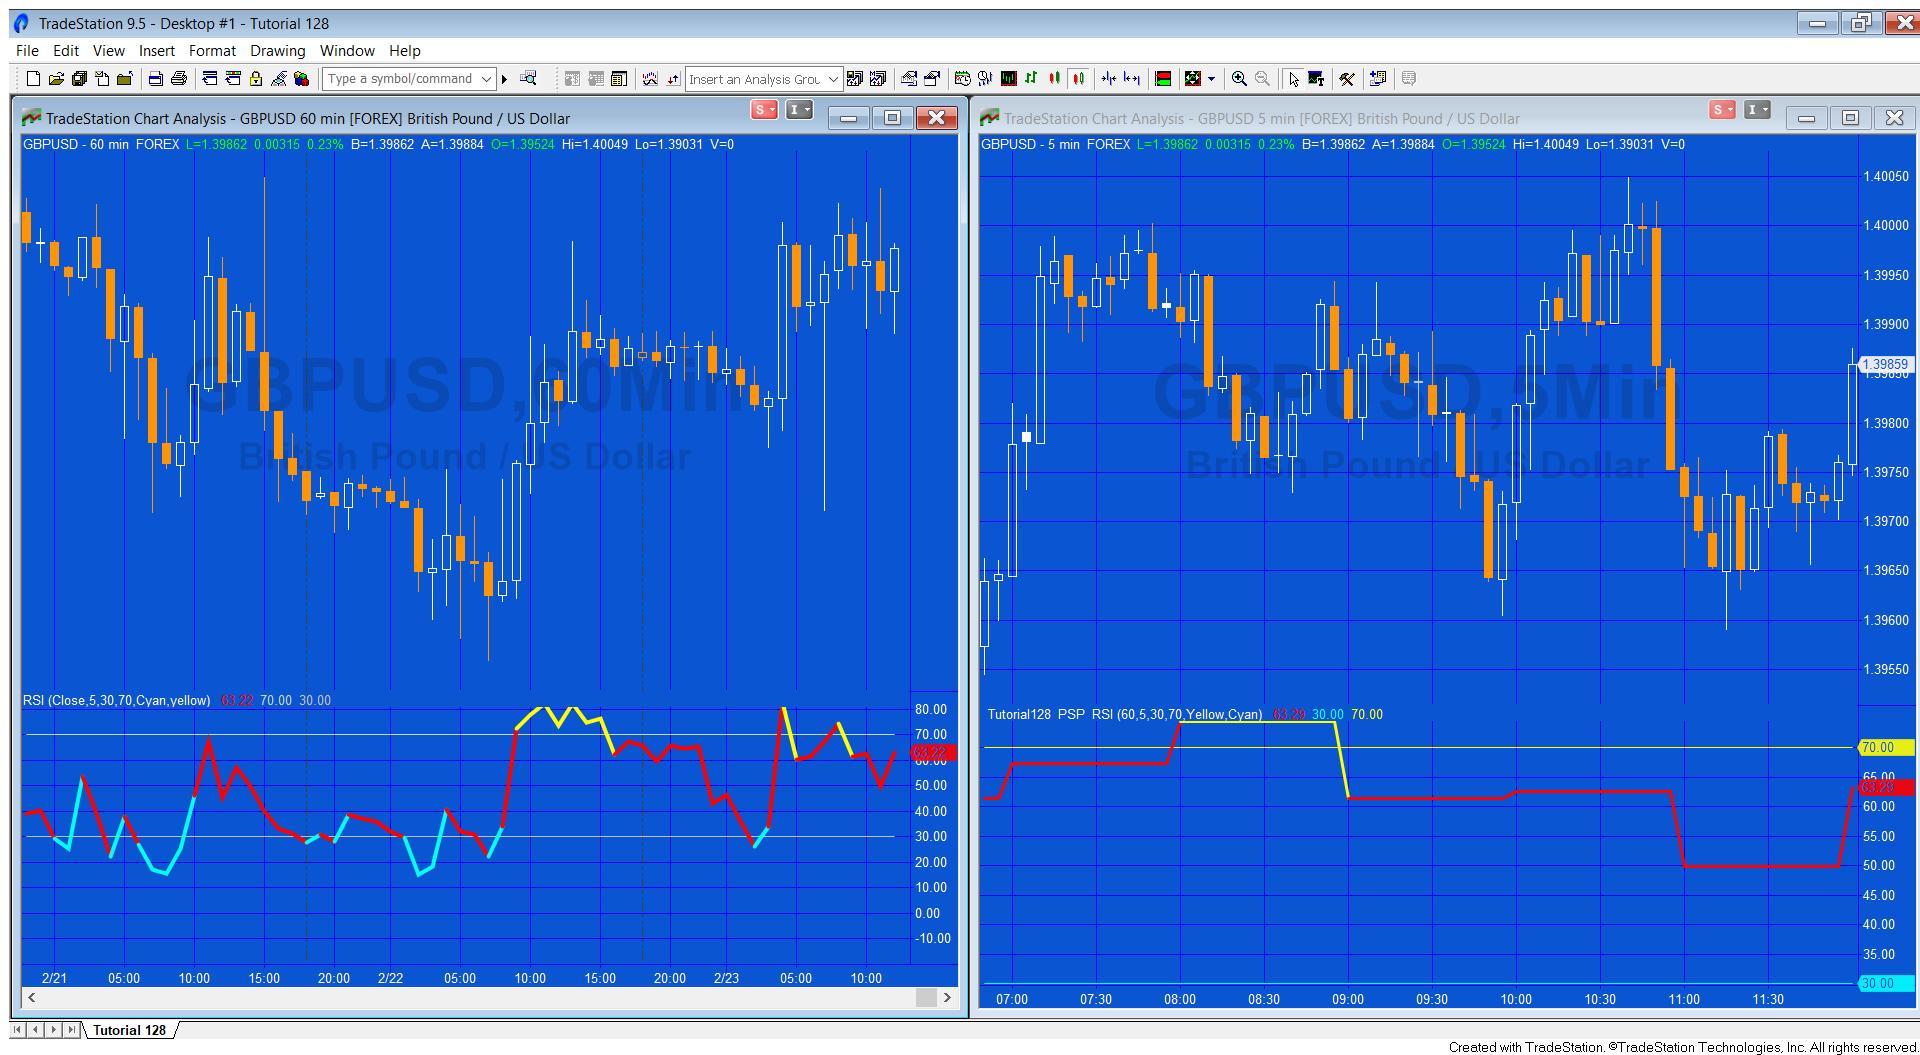
With most standard calculations on TradeStation we begin on the first bar of the chart and then perform the calculation on each bar moving forward. With a PSP we have the option to perform calculations by looking back at the data stored in the PSP. It is this technique that we will use in this tutorial. You might wish to compare the calculation in the TradeStation RSI function with the calculations in this tutorial.
Please let me know if you see any errors or bugs. Bear in mind that, according to TradeStation, the closing of PSP bars and Chart/RadarScreen bars in real-time, are not synchronized. Therefore, the time stamp of PSP ticks (updated events) may not match the time stamp of data stream ticks. This can result in small differences between an RSI calculated.
Gold Pass members can download Tutorial128_PSP_RSI for free.
Programming lessons in _Tutorial128_PSP_RSI
The tutorial demonstrates how to:
- Create an instance of the Price Series Provider by using the EasyLanguage toolbox and populating the property fields
- Emulate the RSI function that calculates the first value of NetChgAvg and TotalChgAvg when CurrentBar = 1 (see the RSI function for a comparison)
- Calculate the RSI values historically
- Calculate the RSI values in real time in an efficient manner
- Plot RSI values and change the plot colors when it becomes oversold or overbought
Download _Tutorial128_PSP_RSI
The UNPROTECTED TradeStation indicator (_Tutorial128_PSP_RSI) is available for IMMEDIATE download for $39.95- by clicking the ‘add to cart’ button.
After purchase you will be redirected to a download page, so don’t close the browser.
Gold Pass area
Gold pass members, make sure that you are logged in to download Tutorial128_PSP_RSI for free.
Video explanation of _Tutorial128_PSP_RSI
Rather than talk through the program that has already been written, in the following videos I recreate the program in four steps.
Part 1 | Initial setup
Part 2 | Calculate the equivalent of what is calculated in the standard function when Currentbar = 1
Part 3 | Do the main calculation using the PSP
Part 4 | Make the calculation more efficient for real time bars
Please let me know if you spot any bugs or errors or have questions.
THESE INDICATORS, SHOW ME STUDIES, STRATEGIES AND OTHER PROGRAMS HAVE BEEN INCLUDED SOLELY FOR EDUCATIONAL PURPOSES.
TO THE BEST OF MARKPLEX CORPORATION’S KNOWLEDGE, ALL OF THE INFORMATION ON THIS PAGE IS CORRECT, AND IT IS PROVIDED IN THE HOPE THAT IT WILL BE USEFUL. HOWEVER, MARKPLEX CORPORATION ASSUMES NO LIABILITY FOR ANY DAMAGES, DIRECT OR OTHERWISE, RESULTING FROM THE USE OF THIS INFORMATION AND/OR PROGRAM(S) DESCRIBED, AND NO WARRANTY IS MADE REGARDING ITS ACCURACY OR COMPLETENESS. USE OF THIS INFORMATION AND/OR PROGRAMS DESCRIBED IS AT YOUR OWN RISK.
ANY EASYLANGUAGE OR POWERLANGUAGE TRADING STRATEGIES, SIGNALS, STUDIES, INDICATORS, SHOWME STUDIES, PAINTBAR STUDIES, PROBABILITYMAP STUDIES, ACTIVITYBAR STUDIES, FUNCTIONS (AND PARTS THEREOF) AND ASSOCIATED TECHNIQUES REFERRED TO, INCLUDED IN OR ATTACHED TO THIS TUTORIAL OR PROGRAM DESCRIPTION ARE EXAMPLES ONLY, AND HAVE BEEN INCLUDED SOLELY FOR EDUCATIONAL PURPOSES. MARKPLEX CORPORATION. DOES NOT RECOMMEND THAT YOU USE ANY SUCH TRADING STRATEGIES, SIGNALS, STUDIES, INDICATORS, SHOWME STUDIES, PAINTBAR STUDIES, PROBABILITYMAP STUDIES, ACTIVITYBAR STUDIES, FUNCTIONS (OR ANY PARTS THEREOF) OR TECHNIQUES. THE USE OF ANY SUCH TRADING STRATEGIES, SIGNALS, STUDIES, INDICATORS, SHOWME STUDIES, PAINTBAR STUDIES, PROBABILITYMAP STUDIES, ACTIVITYBAR STUDIES, FUNCTIONS AND TECHNIQUES DOES NOT GUARANTEE THAT YOU WILL MAKE PROFITS, INCREASE PROFITS, OR MINIMIZE LOSSES.
Text content