
Display activity bars when trades at bid or ask exceed a certain value
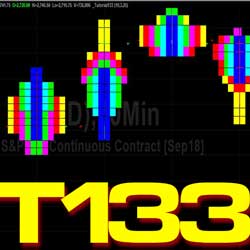 One of Markplex’s YouTube subscribers requested a tutorial to demonstrate the TradeStation Time&Sales provider. He wanted to understand how one could use the provider to find trades executed at the last ask or at the last bid price whose size (in terms of contracts or shares) was bigger than a user input. The request was to display these trades using an EasyLanguage show-me study, but, perhaps I thought it would be more appropriate to use an ActivityBar study. EasyLanguage ActivityBar studies can display the approximate price levels on a bar where the trades took place. Read an introduction to ActivityBars below.
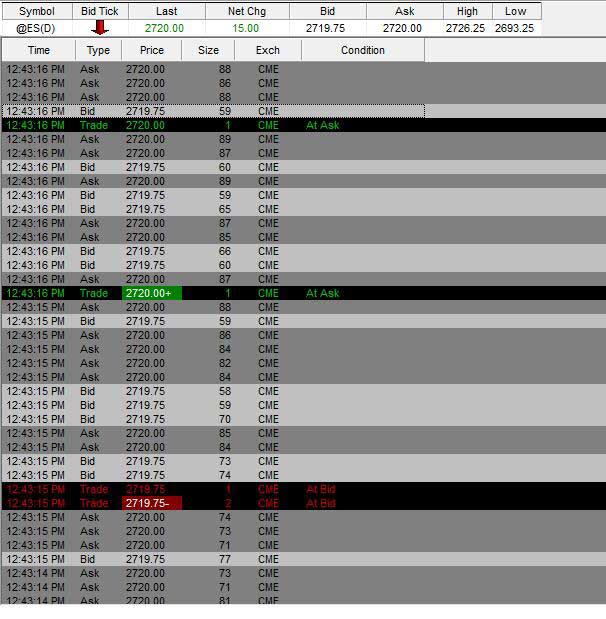
This tutorial uses the TradeStation Time and Sales class to create an object which enables the user to monitor and analyze time and sales information programmatically. Each time a bid or ask is posted, the object fires an update event and the bid or ask price is recorded. When a trade takes place with a price equal to the last bid or ask price and with a number of contracts greater than the MinTradeSize user input, the TradeAtBidCounter or TradeAtAskCounter is incremented, respectively. The Time and Sales object is not available within MultiCharts and so this tutorial program will not work with MultiCharts.
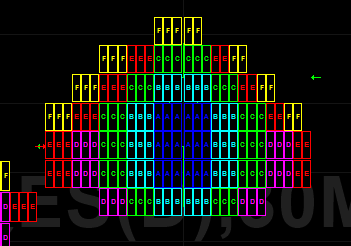
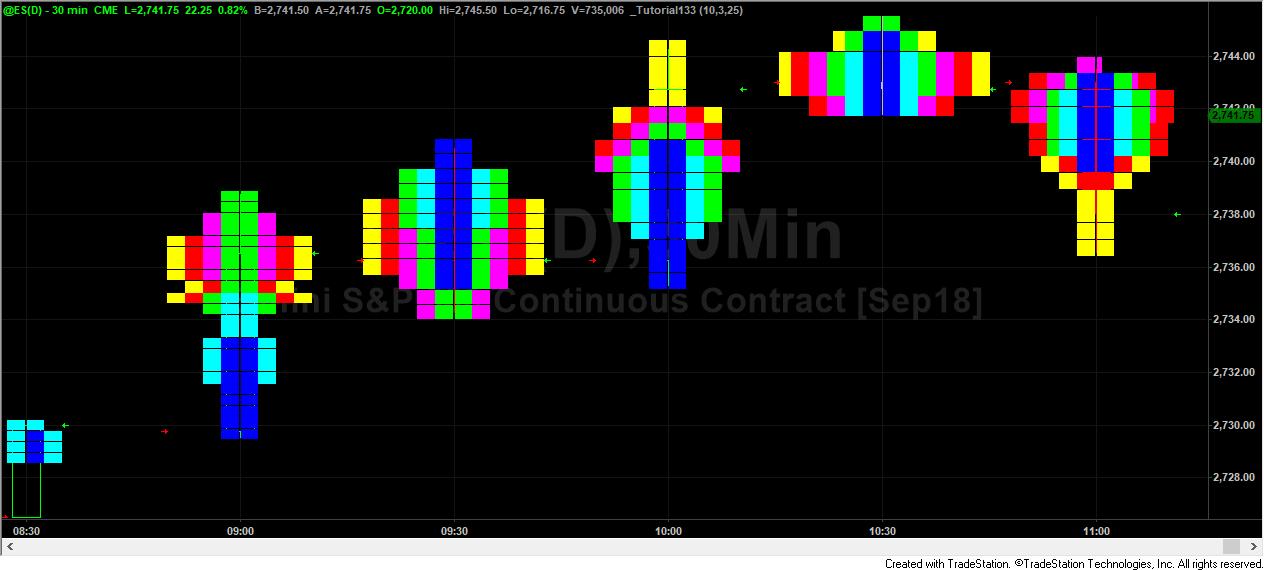
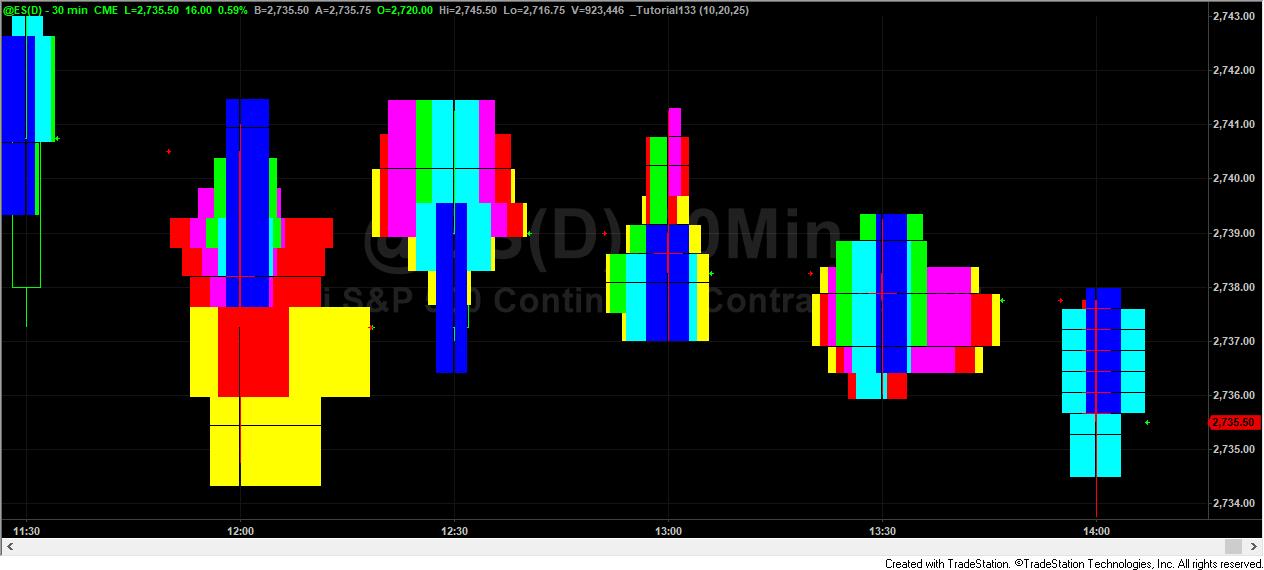
An ActivityBar study is then used to add a cell or cells on the chart for the price range covered by the specific ActivityBar being developed for the TradeAtBidCounter and TradeAtAskCounter up to a maximum number of cells (again specified by user input: MaxWeight). The program adds cells for the TradeAtBidCounter on the right of the current Data1 bar and it adds cells for the TradeAtAskCounter on the left of the current Data1 bar.
Introduction to ActivityBars
ActivityBar studies analyse bars based on look-inside-data of smaller ActivityBars. For example, a 30 minute bar might use 5 minute ActivityBars. ActivityBar studies uses ‘cells’ (little rectangles) to display information about a bar based on the range of prices for each underlying ActivityBar. The number of rows of cells can be controlled according to some other quantity related to the ActivityBar being analysed.
The colors of the cells and the text within them can be changed for each ActivityBars.
The ApproxNumRows user input determines the approximate number of cell rows placed between the high and low prices of the ActivityBar.
Probably one of the simplest ActivityBar studies is the Price Distribution ActivityBar study which uses cells to show the range of prices for each ActivityBar interval within the price bar. The number of cells distributed on any one row or among several rows reveals in how many of the ActivityData intervals the price occurred.
TradeStation created a very good introduction to the functionality of its ActivityBar studies here: https://www.youtube.com/watch?v=j7kXbPjM7rU
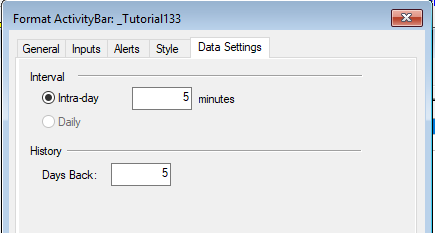
Inputs and data settings
The tutorial program has the following inputs:
ApproxNumRows: The approximate number of rows of cells to use in the study.
The study calls the standard AB_RowHeightCalc function which uses a calculation of the average range over 3 bars, divided by the ApproxNumRows input to determine what the row height should be set to. The number of rows on each ActivityBar will be likely to vary. If the above calculation results in a row height value that is smaller than the minimum movement of the symbol, the minimum movement is returned.
MaxWeight: The maximum number of columns to plot based on the number of the TradeAtBidCounter and TradeAtAskCounter.
MinTradeSize: The minimum trade size to consider when counting trades at the last bid or ask.
As well as the inputs, the data setting tab enables you to set the interval of the Activity Bar. For example, you might use a data1 bar of 30 minutes and an intra-day interval of 5 minutes.
- Creating an object of the Time and Sales Provider class
- Using a method to determine when the ‘big’ data1 bars end and when the small ActivityBars end
- Using ActivityBars and understanding differences from the behavior of an indicator or show me study
- Determining if the chart is set to local or exchange time using the DataStreams Class
Because the Time and Sales provider only provides real time data when the ActivityBar study is first applied to a chart no ‘cells’ will appear. The cells will start to appear as the real time data develops.
Note that if the program is applied part way through the development of a real time bar, the cell colors and cell letters will appear if if it were the start of the bar. The next ActivityBar will be created properly.
Download
Video explanation of Tutorial 133 Part 1
Video explanation of Tutorial 133 Part 2
The variable declaration
Note that some variables are declared as intrabarpersist.
int MinuteInterval( BarInterval of ActivityData ),
TimeAndSalesProvider TSProv( NULL ),
intrabarpersist double LastBid( 0.0 ),
intrabarpersist double LastAsk( 0.0 ),
intrabarpersist double LastTrade( 0.0 ),
intrabarpersist double DataPrice( 0.0 ),
intrabarpersist int TradeAtBidCounter( 0 ),
intrabarpersist int TradeAtAskCounter( 0 ),
intrabarpersist int CC( 0 ),
intrabarpersist int CCLastBigBar( 0 ),
intrabarpersist Int NextCol( 0 ),
intrabarpersist int NextLabelIndex( 0 ),
intrabarpersist string Label( “” ),
int BGColor( RGBToLegacyColor( GetBackGroundColor ) );
Please let me know if you spot any mistakes or errors or have questions.
THESE INDICATORS, SHOW ME STUDIES, STRATEGIES AND OTHER PROGRAMS HAVE BEEN INCLUDED SOLELY FOR EDUCATIONAL PURPOSES.
TO THE BEST OF MARKPLEX CORPORATION’S KNOWLEDGE, ALL OF THE INFORMATION ON THIS PAGE IS CORRECT, AND IT IS PROVIDED IN THE HOPE THAT IT WILL BE USEFUL. HOWEVER, MARKPLEX CORPORATION ASSUMES NO LIABILITY FOR ANY DAMAGES, DIRECT OR OTHERWISE, RESULTING FROM THE USE OF THIS INFORMATION AND/OR PROGRAM(S) DESCRIBED, AND NO WARRANTY IS MADE REGARDING ITS ACCURACY OR COMPLETENESS. USE OF THIS INFORMATION AND/OR PROGRAMS DESCRIBED IS AT YOUR OWN RISK.
ANY EASYLANGUAGE OR POWERLANGUAGE TRADING STRATEGIES, SIGNALS, STUDIES, INDICATORS, SHOWME STUDIES, PAINTBAR STUDIES, PROBABILITYMAP STUDIES, ACTIVITYBAR STUDIES, FUNCTIONS (AND PARTS THEREOF) AND ASSOCIATED TECHNIQUES REFERRED TO, INCLUDED IN OR ATTACHED TO THIS TUTORIAL OR PROGRAM DESCRIPTION ARE EXAMPLES ONLY, AND HAVE BEEN INCLUDED SOLELY FOR EDUCATIONAL PURPOSES. MARKPLEX CORPORATION. DOES NOT RECOMMEND THAT YOU USE ANY SUCH TRADING STRATEGIES, SIGNALS, STUDIES, INDICATORS, SHOWME STUDIES, PAINTBAR STUDIES, PROBABILITYMAP STUDIES, ACTIVITYBAR STUDIES, FUNCTIONS (OR ANY PARTS THEREOF) OR TECHNIQUES. THE USE OF ANY SUCH TRADING STRATEGIES, SIGNALS, STUDIES, INDICATORS, SHOWME STUDIES, PAINTBAR STUDIES, PROBABILITYMAP STUDIES, ACTIVITYBAR STUDIES, FUNCTIONS AND TECHNIQUES DOES NOT GUARANTEE THAT YOU WILL MAKE PROFITS, INCREASE PROFITS, OR MINIMIZE LOSSES.