
Drawing various charts on a form using a multi-input, multi-output method
Join the Markplex email list to get updates about new programs and tutorials.
Subscribe to the Markplex YouTube channel.
 EasyLanguage tutorial 139 demonstrates how to create sub-charts on a form docked to a price chart. The tutorial program uses a Market Depth Provider and a Time and Sales Provider.
In the tutorial video, I demonstrate how you would go about creating the chart configuration settings using the TDE ToolBox and then copying from the designer generated code. You could also use the tutorial program as the basis for you own modified program.
The main method has several inputs and two outputs. The inputs determine the title of the chart, the background color, and what sort of chart is it (e.g Pie chart, bar chart, bubble chart or column chart). The outputs are the chart itself and the chart data series associated with it.
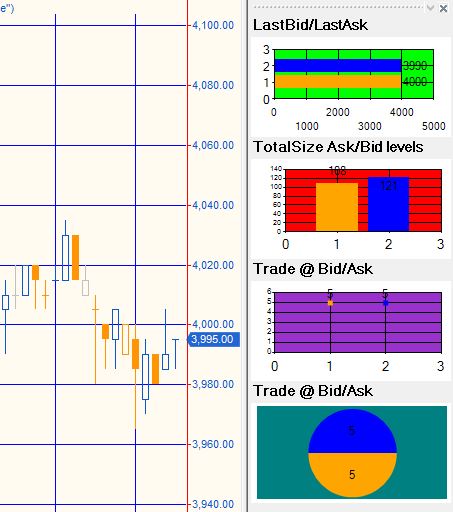
In the tutorial the charts, from top to bottom, are:
- Bar chart showing the last bid price and the last ask price
- Column chart showing the TotalSize of the first 3 ask/bid levels
- Bubble chart showing the number of trades at the ask price and the number of trades at the bid price
- Price chart showing the number of trades at the ask price and the number of trades at the bid price
The charts are highly customizable, however in this tutorial I have used fairly simple setups.
Inputs
The tutorial program has the following inputs:
int MinTradeSize( 0 ), // The minimum trade size to consider when counting trades at the last bid or ask
String Color1( “Orange” ),
String Color2( “Blue” );
- Using methods
- Creating a Time and Sales Provider and Market Depth Provider with update events
- Automatically setting the provider to use local or exchange according to the timezone of the chart
- Creating a form, charts, labels, and chart data series
- Simplifying the code by creating a method to create charts
Download
Video explanation of Tutorial 139
Please let me know if you see any mistakes or errors or have questions.
THESE INDICATORS, SHOW ME STUDIES, STRATEGIES AND OTHER PROGRAMS HAVE BEEN INCLUDED SOLELY FOR EDUCATIONAL PURPOSES.
TO THE BEST OF MARKPLEX CORPORATION’S KNOWLEDGE, ALL OF THE INFORMATION ON THIS PAGE IS CORRECT, AND IT IS PROVIDED IN THE HOPE THAT IT WILL BE USEFUL. HOWEVER, MARKPLEX CORPORATION ASSUMES NO LIABILITY FOR ANY DAMAGES, DIRECT OR OTHERWISE, RESULTING FROM THE USE OF THIS INFORMATION AND/OR PROGRAM(S) DESCRIBED, AND NO WARRANTY IS MADE REGARDING ITS ACCURACY OR COMPLETENESS. USE OF THIS INFORMATION AND/OR PROGRAMS DESCRIBED IS AT YOUR OWN RISK.
ANY EASYLANGUAGE OR POWERLANGUAGE TRADING STRATEGIES, SIGNALS, STUDIES, INDICATORS, SHOWME STUDIES, PAINTBAR STUDIES, PROBABILITYMAP STUDIES, ACTIVITYBAR STUDIES, FUNCTIONS (AND PARTS THEREOF) AND ASSOCIATED TECHNIQUES REFERRED TO, INCLUDED IN OR ATTACHED TO THIS TUTORIAL OR PROGRAM DESCRIPTION ARE EXAMPLES ONLY, AND HAVE BEEN INCLUDED SOLELY FOR EDUCATIONAL PURPOSES. MARKPLEX CORPORATION. DOES NOT RECOMMEND THAT YOU USE ANY SUCH TRADING STRATEGIES, SIGNALS, STUDIES, INDICATORS, SHOWME STUDIES, PAINTBAR STUDIES, PROBABILITYMAP STUDIES, ACTIVITYBAR STUDIES, FUNCTIONS (OR ANY PARTS THEREOF) OR TECHNIQUES. THE USE OF ANY SUCH TRADING STRATEGIES, SIGNALS, STUDIES, INDICATORS, SHOWME STUDIES, PAINTBAR STUDIES, PROBABILITYMAP STUDIES, ACTIVITYBAR STUDIES, FUNCTIONS AND TECHNIQUES DOES NOT GUARANTEE THAT YOU WILL MAKE PROFITS, INCREASE PROFITS, OR MINIMIZE LOSSES.