
Analysis of trade size using Time and Sales and Price Series providers
Tutorial 143 uses TradeStation’s Time and Sales and Price Series providers to calculate and provide an analysis of trade sizes within a bar. The theory behind it being that fewer trades of larger volume might affect the market in different ways to a larger number of smaller trades.
Tutorial 143 calculates and plots:
- A plot of the volume in the upper 5%/10%/25% (according to a user input) of trades (ranked by trade size) divided by the total volume for each bar
- The average trade size (bar volume divided by bar ticks)
- The largest trade for each bar
The theory underlying Tutorial 143 is that the traders trading making relatively larger trades may be more influential in determining market direction than those trading smaller or individual lots.
Watch the overview video below.
Tutorial 143 is available for immediate download for $79.95. The download is a TradeStation ELD file that includes the unprotected and commented program. It works with TradeStation version 9.5 and 10.0.
This program will not work in MultiCharts because it uses the TradeStation collections and other functionality that is not available in the MultiCharts environment.
How tutorial 143 works
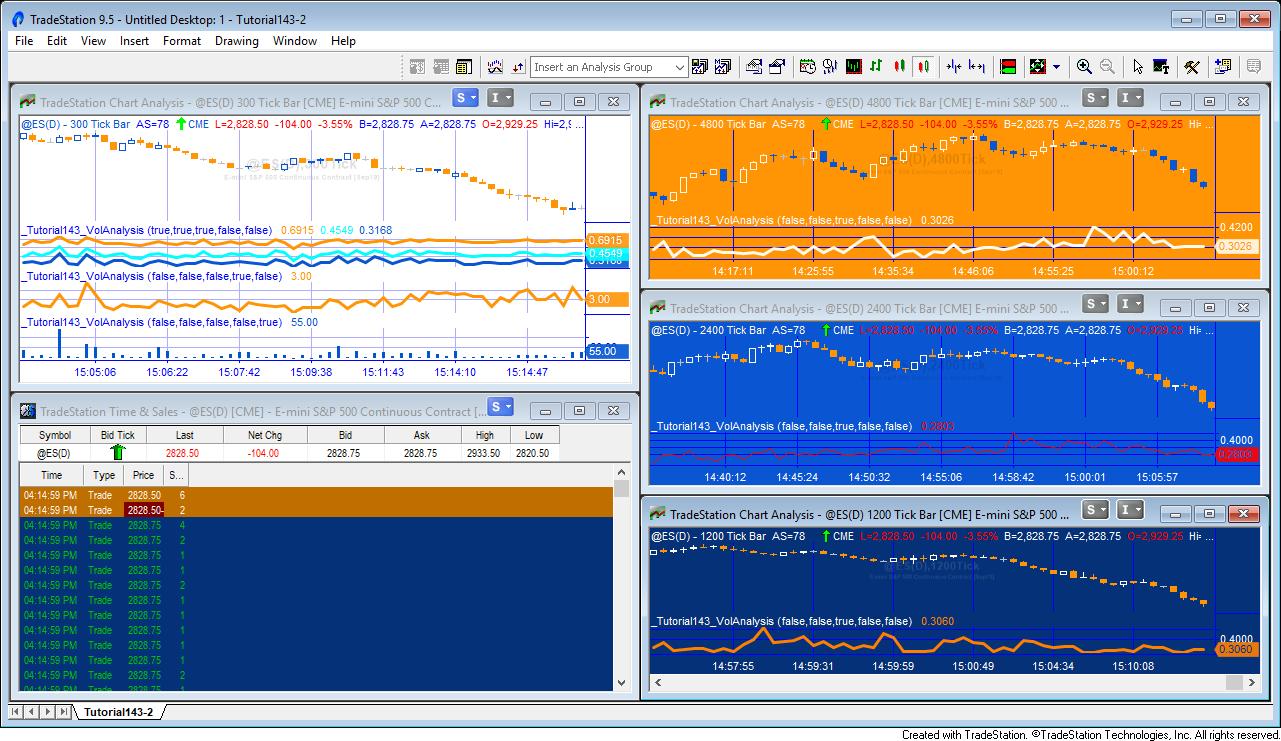
The program has, potentially, five plots available. Whether a plot is made is determined by the following user inputs:
bool Qvol( false ), // Set to true to plot upper quartile volume
bool Tvol( false ), // Set to true to plot upper ten percentile volume
bool Fvol( true ), // Set to true to plot upper five percentile volume
bool AvVol( false ), // Set to true to plot average volume (volume/ticks)
bool HNumCts( false ); // Set to true to show highest number of contracts for each bar
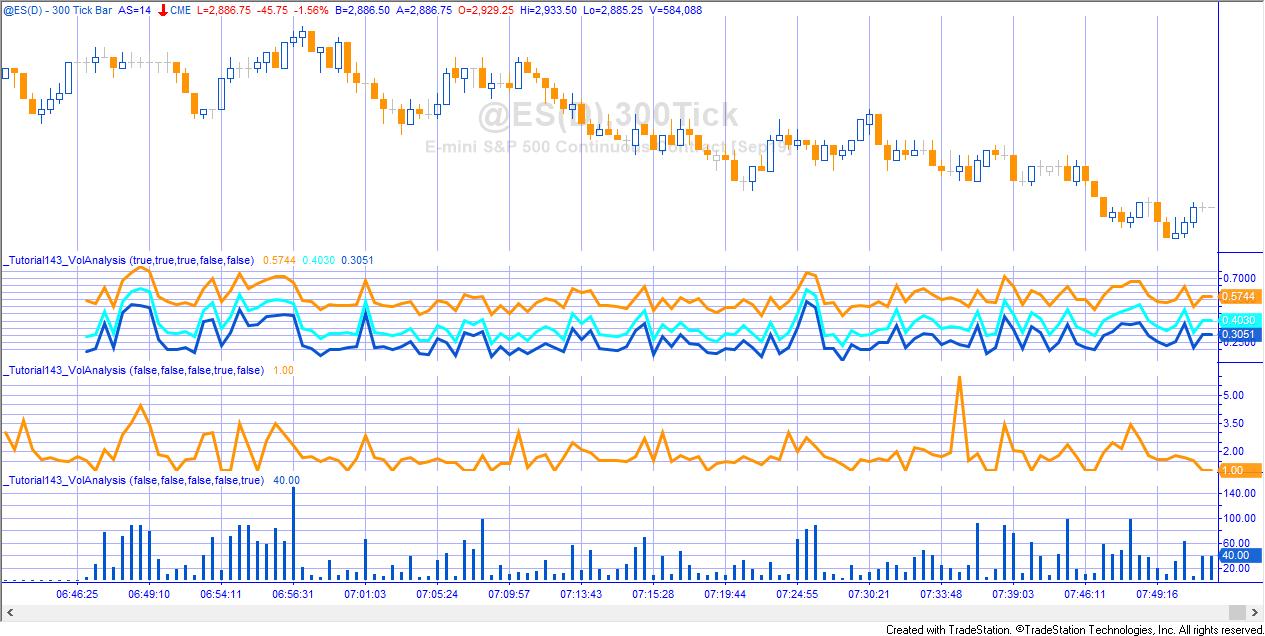
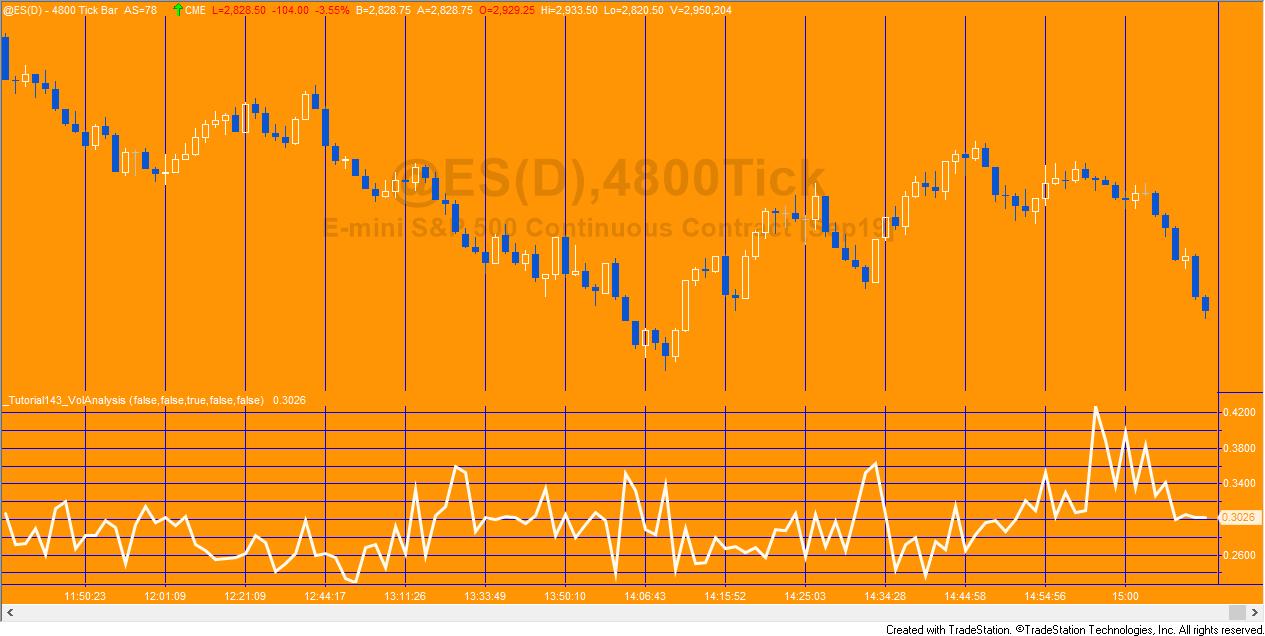
Volume in the upper 5% of trades divided by the total volume (set FVol to TRUE)
 When the Time and Sales update event occurs tutorial 143 determines whether a trade has taken place (as opposed to a ‘bid’ or an ‘ask’ event). If so the size of the trade (i.e. number of contracts) is added as a new item to a vector. Using a method, it is placed in the vector so that the largest trade is at the top of the vector and the smallest at the bottom, in other words the vector is continually sorted according to trade size. Tutorial 143 also keeps a tally of the total volume of trades.
On the last tick of the bar the program sums the volume in the top 5% of trades. For example, if there were 1,000 trades, the program would add up the volume in the top 50 trades (by size). This number if divided by the total volume for that bar and plotted on the chart.
Similarly, if Qvol is set to true the volume in the top 25% of trades (sorted according to number of contracts per trade) is summed and divided by the total volume for that bar and plotted. If Tvol is set to true the volume in the top 10% of trades is summed and divided by the total volume for that bar and plotted.
Average number of contracts in a trade
The average trade size if calculated using information from a price series provider. The volume for each bar is divided by the ticks. This metric is calculated and plotted historically.
Largest trade for each bar
This metric is calculated like the volume in the upper 5% calculation described above. Since the vector is effectively continuously sorted while it is being populated, the value of the top element (the first element in the vector) is plotted.
Commented out print statements
Print statements are commented out and are not necessary for the running of the program. They are left in the source code in case you wish to use them to do your own verification or capture other data.
Video demonstration
Inputs
bool Qvol( false ), // Set to true to plot upper quartile volume
bool Tvol( false ), // Set to true to plot upper ten percentile volume
bool Fvol( true ), // Set to true to plot upper five percentile volume
bool AvVol( false ), // Set to true to plot average volume (volume/ticks)
bool HNumCts( false ); // Set to true to show highest number of contracts for each bar
Technical architecture and programming lessons
Tutorial 143 uses the Time and Sales provider and the Price Series Provider. It also uses a vector which is populated while a bar is developing such that it is always sorted by the number of contracts traded. It may be useful if you are looking for examples of:
- Creating a new Price Series Provider and a Time and Sales Provider
- Creating, clearing and managing a vector
- Keeping a vector continually sorted
Please email if you find any bugs,notice any errors, or have questions about the tutorial.
THESE INDICATORS, SHOW ME STUDIES, STRATEGIES AND OTHER PROGRAMS HAVE BEEN INCLUDED SOLELY FOR EDUCATIONAL PURPOSES.
TO THE BEST OF MARKPLEX CORPORATION’S KNOWLEDGE, ALL OF THE INFORMATION ON THIS PAGE IS CORRECT, AND IT IS PROVIDED IN THE HOPE THAT IT WILL BE USEFUL. HOWEVER, MARKPLEX CORPORATION ASSUMES NO LIABILITY FOR ANY DAMAGES, DIRECT OR OTHERWISE, RESULTING FROM THE USE OF THIS INFORMATION AND/OR PROGRAM(S) DESCRIBED, AND NO WARRANTY IS MADE REGARDING ITS ACCURACY OR COMPLETENESS. USE OF THIS INFORMATION AND/OR PROGRAMS DESCRIBED IS AT YOUR OWN RISK.
ANY EASYLANGUAGE OR POWERLANGUAGE TRADING STRATEGIES, SIGNALS, STUDIES, INDICATORS, SHOWME STUDIES, PAINTBAR STUDIES, PROBABILITYMAP STUDIES, ACTIVITYBAR STUDIES, FUNCTIONS (AND PARTS THEREOF) AND ASSOCIATED TECHNIQUES REFERRED TO, INCLUDED IN OR ATTACHED TO THIS TUTORIAL OR PROGRAM DESCRIPTION ARE EXAMPLES ONLY, AND HAVE BEEN INCLUDED SOLELY FOR EDUCATIONAL PURPOSES. MARKPLEX CORPORATION. DOES NOT RECOMMEND THAT YOU USE ANY SUCH TRADING STRATEGIES, SIGNALS, STUDIES, INDICATORS, SHOWME STUDIES, PAINTBAR STUDIES, PROBABILITYMAP STUDIES, ACTIVITYBAR STUDIES, FUNCTIONS (OR ANY PARTS THEREOF) OR TECHNIQUES. THE USE OF ANY SUCH TRADING STRATEGIES, SIGNALS, STUDIES, INDICATORS, SHOWME STUDIES, PAINTBAR STUDIES, PROBABILITYMAP STUDIES, ACTIVITYBAR STUDIES, FUNCTIONS AND TECHNIQUES DOES NOT GUARANTEE THAT YOU WILL MAKE PROFITS, INCREASE PROFITS, OR MINIMIZE LOSSES.