
A Gold Pass member was developing an example strategy involving two averages crossing each other to trigger a market buy order. He did not want to have to wait until the next bar to enter the trade but he did not want to enter a market order immediately. He asked how to go about introducing a user input number of ticks between the price where the cross occurs and the level that has to be reached (or exceeded) to place the market buy order.
The formula used in the expoenential moving average function is:
if CurrentBar = 1 then XAverage = Price
else XAverage = XAverage[1] + SmoothingFactor * ( Price – XAverage[1] );
If we use XAverage( C, 1 ) then the SmoothingFactor = 1.
XAverage = XAverage[1] + SmoothingFactor * ( Price – XAverage[1] ) becomes
XAverage = XAverage[1] + 1 * ( Price – XAverage[1] ), i.e.
XAverage = XAverage[1] + Price – XAverage[1] i.e.
XAverage = XAverage[1] – XAverage[1] + Price i.e.
XAverage = Price
How tutorial 144 works
Tutorial 144 works by:
- Monitoring the value of the difference between the fast and slow averages on a tick by tick basis
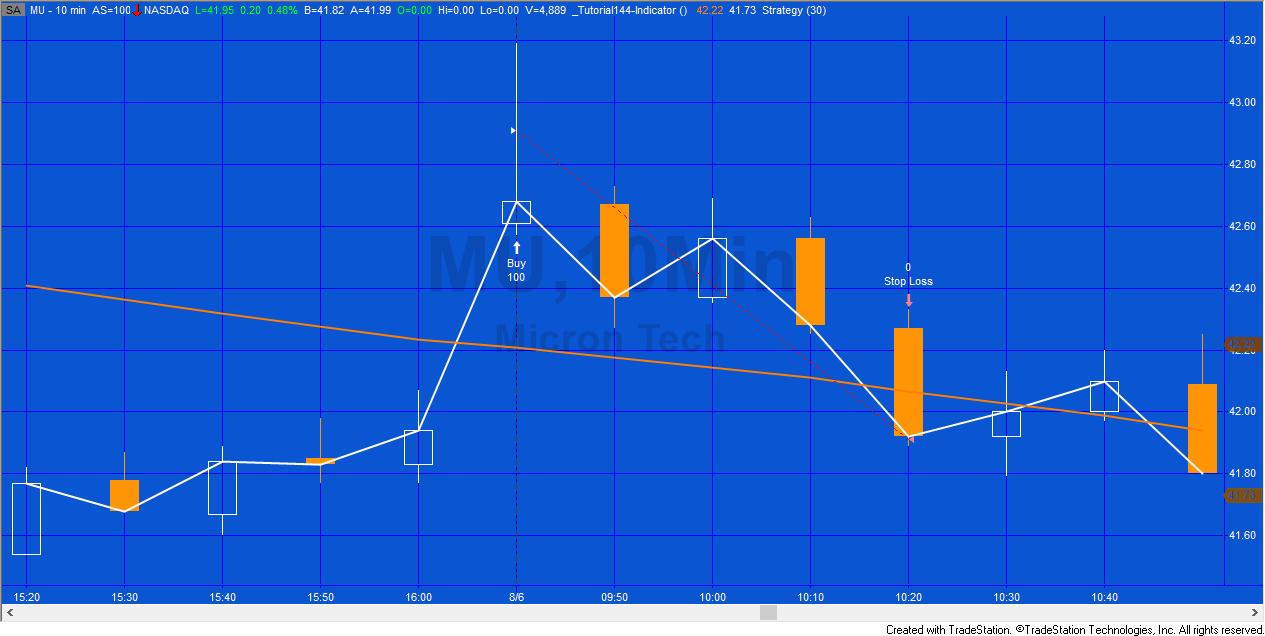
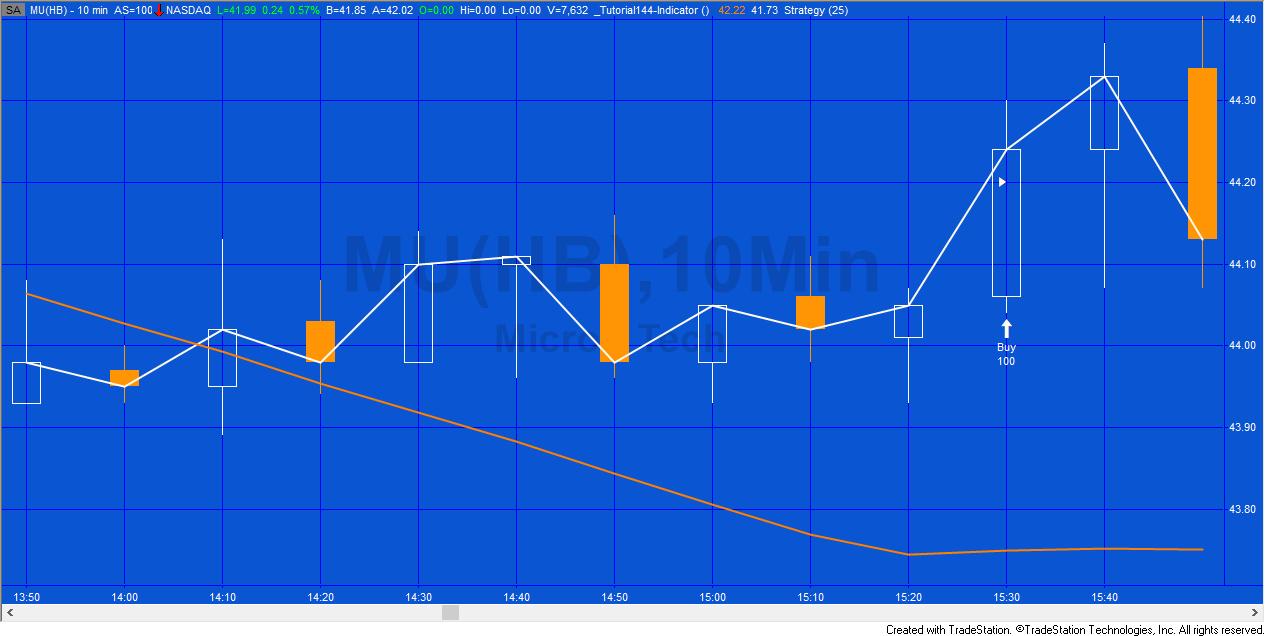
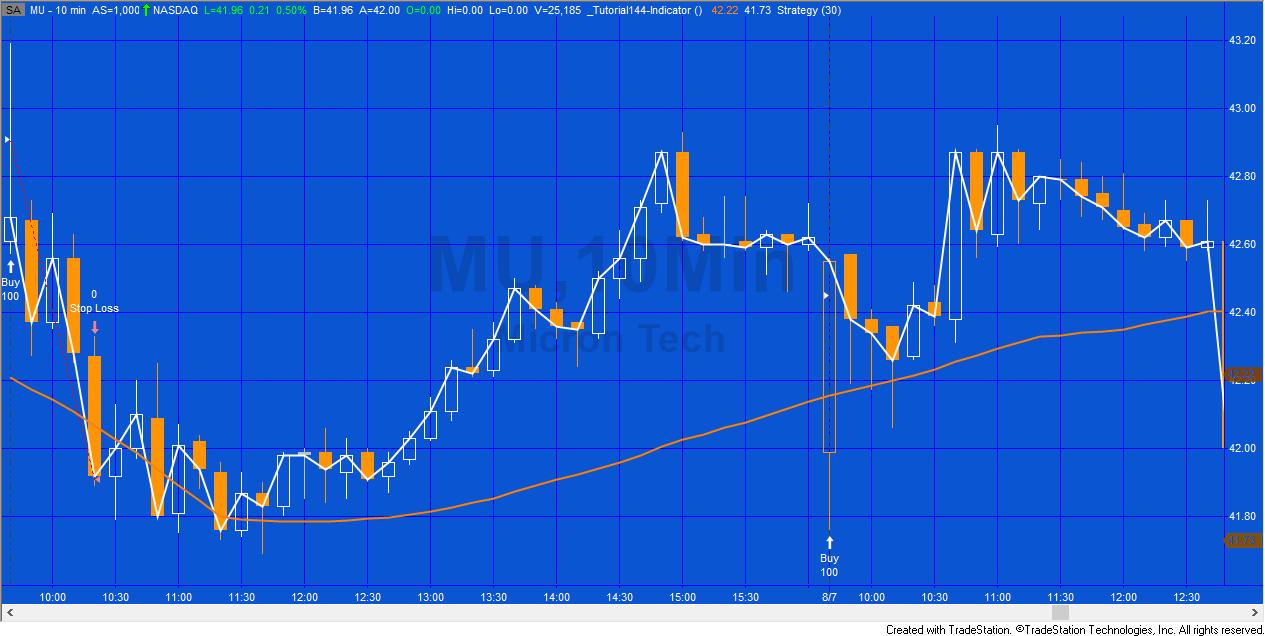
- If the lines cross (i.e. the value of the difference is positive this tick but was negative the previous tick) set a boolean to true and record the value of close in an intrabarpersist variable
- The entry price target is calculated and the market order requires
- The boolean to be true
- The price entry target to be exceeded
- If the fast average crosses below the slow average then the boolean is set to false
Watch the overview video below.
Tutorial 144 is available for free download for Gold Pass members. The download consists of two strategies and an indicator in a TradeStation ELD file that includes the unprotected and commented programs. This program will work in MultiCharts.
The indicator plots the averages. The inputs in the indicator and the strategies are NOT synchronized, i.e. the user needs to make sure that the same averages are being plotted with the indicator as used in the strategies.
Input
NumTcksAbove( 5 );
The input is an integer that determines how many ticks above the price when the average cross occurs to insitigate a marke buy order.
Gold Pass download area (make sure you are logged in)
As mentioned above, averages change with price and in the above image the bar opened lower than the previous bar and then moved upwards. What happened was, earlier in the bar’s development the averages crossed setting up a target for a potential market entry. Price subsequently reached this level and a market buy order was initiated. As mentioned in the video, to stop this situation would require adding addiional logic to the program.
Video demonstration
Please email if you find any bugs,notice any errors, or have questions about the tutorial.
THESE INDICATORS, SHOW ME STUDIES, STRATEGIES AND OTHER PROGRAMS HAVE BEEN INCLUDED SOLELY FOR EDUCATIONAL PURPOSES.
TO THE BEST OF MARKPLEX CORPORATION’S KNOWLEDGE, ALL OF THE INFORMATION ON THIS PAGE IS CORRECT, AND IT IS PROVIDED IN THE HOPE THAT IT WILL BE USEFUL. HOWEVER, MARKPLEX CORPORATION ASSUMES NO LIABILITY FOR ANY DAMAGES, DIRECT OR OTHERWISE, RESULTING FROM THE USE OF THIS INFORMATION AND/OR PROGRAM(S) DESCRIBED, AND NO WARRANTY IS MADE REGARDING ITS ACCURACY OR COMPLETENESS. USE OF THIS INFORMATION AND/OR PROGRAMS DESCRIBED IS AT YOUR OWN RISK.
ANY EASYLANGUAGE OR POWERLANGUAGE TRADING STRATEGIES, SIGNALS, STUDIES, INDICATORS, SHOWME STUDIES, PAINTBAR STUDIES, PROBABILITYMAP STUDIES, ACTIVITYBAR STUDIES, FUNCTIONS (AND PARTS THEREOF) AND ASSOCIATED TECHNIQUES REFERRED TO, INCLUDED IN OR ATTACHED TO THIS TUTORIAL OR PROGRAM DESCRIPTION ARE EXAMPLES ONLY, AND HAVE BEEN INCLUDED SOLELY FOR EDUCATIONAL PURPOSES. MARKPLEX CORPORATION. DOES NOT RECOMMEND THAT YOU USE ANY SUCH TRADING STRATEGIES, SIGNALS, STUDIES, INDICATORS, SHOWME STUDIES, PAINTBAR STUDIES, PROBABILITYMAP STUDIES, ACTIVITYBAR STUDIES, FUNCTIONS (OR ANY PARTS THEREOF) OR TECHNIQUES. THE USE OF ANY SUCH TRADING STRATEGIES, SIGNALS, STUDIES, INDICATORS, SHOWME STUDIES, PAINTBAR STUDIES, PROBABILITYMAP STUDIES, ACTIVITYBAR STUDIES, FUNCTIONS AND TECHNIQUES DOES NOT GUARANTEE THAT YOU WILL MAKE PROFITS, INCREASE PROFITS, OR MINIMIZE LOSSES.