
Using Streamwriter/reader to store and retrieve data that disappears when a chart is reloaded
 There are certain elements of data in TradeStation for which historical information is not available. Insidebid and Insideask are examples of such information.
If you were to create an indicator containing the following two lines and apply it to a chart:
Plot1( Insidebid );
Plot2( Insideask );
The information would be plotted on a chart as real time data arrived. After a few minutes the chart might look something like the chart on the left. If we then reload the chart, all the data disappears and the chart will now look like the image on the right.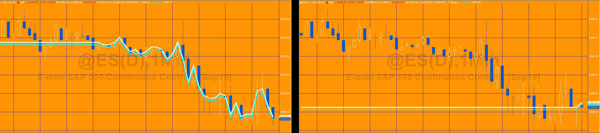
Tutorial 145 demonstrates how to retain historical data by storing information in a text file, using Streamwriter. When the chart is reloaded the program then checks each bar to see if there is data available in the text file for that bar using Streamreader and a Dictionary. If data is available for a bar, it is retrieved is available for use. For real time bars arriving the real time data can be used and displayed, but it is also stored in the text file, for possible future use.
How tutorial 145 works
The tutorial 145 program works by:
- Checking if a file exists with the path and file name specified by a user input. If not, the text file is created using Streamwriter.
- For each bar Streamwriter adds a new line, in a comma separated string format, containing:
- The date time
- Insidebid
- Insideask
- Closing price
- Reading the contents of the text file using Streamreader when the program is first made active
- If the text file contains information then each line is added to a Dictionary with the first item of each line used as in the index.
- The dictionary is referenced for each bar on the chart to verify whether information for that bar is stored in the dictionary. If so the information is retrieved and plotted
- For real time bars, a real time plot of Insidebid and Insideask is made
BarDateTime.Format( "%m/%d/%y %H:%M:%S" )
An example of this format is:
08/12/19 10:04:00
When the tutorial is first applied to a chart magenta and cyan lines show real time data. The following chart was left to develop until the real time plot filled the whole chart.

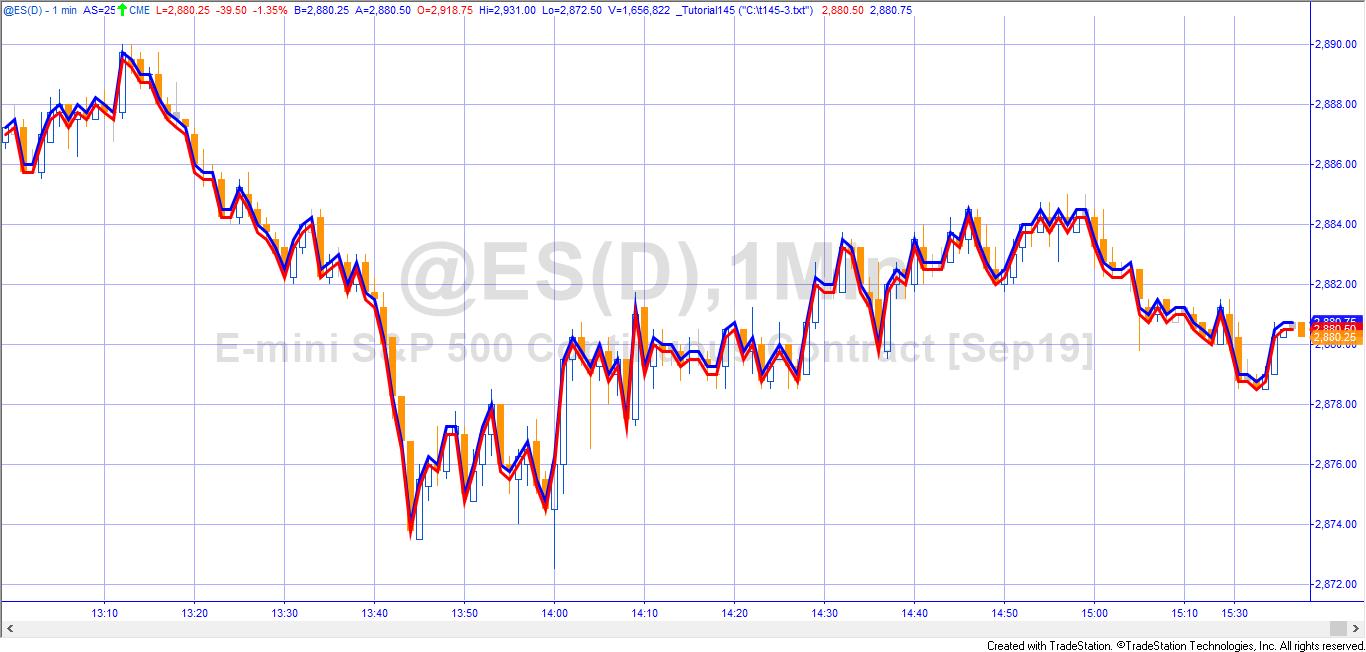
After the real time plot, above, the chart was reloaded, data stored in the text file was accessed and the plot made in the chart below. The plot of data that is retrieved from the text file is shown in red and blue.
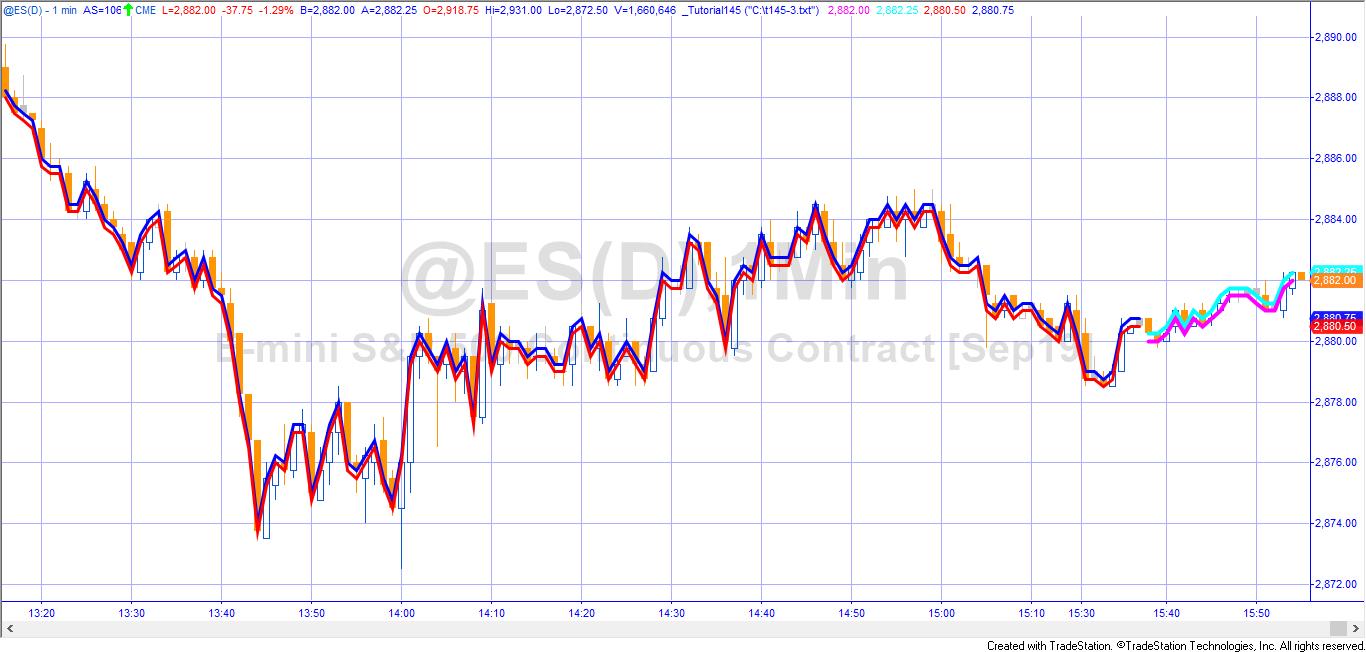
After several minutes, more real time data has started to be plotted on the chart. See below:
Technical lessons
- Creating and using a dictionary
- Using a tokenlist to extract data from a comma delimited list
- Creating Streamwriter and Streamreader objects
- Going through each line of the text file with the Streamreader
- Storing data with the Streamwriter
- Closing the Streamwriter and Streamreader objects
Watch the overview video below.
Tutorial 145 is available for free download for Gold Pass members. It is available for $19.95 for others. The download consists of an TradeStation ELD file that includes the unprotected and commented programs. This program will not work in MultiCharts.
Input
FileNameAndPath( "C:\t145.txt" );
The input is a string containing a valid (and accessible) file name and path.
Gold Pass download area (make sure you are logged in)
Video demonstration
Please email if you find any bugs,notice any errors, or have questions about the tutorial.
THESE INDICATORS, SHOW ME STUDIES, STRATEGIES AND OTHER PROGRAMS HAVE BEEN INCLUDED SOLELY FOR EDUCATIONAL PURPOSES.
TO THE BEST OF MARKPLEX CORPORATION’S KNOWLEDGE, ALL OF THE INFORMATION ON THIS PAGE IS CORRECT, AND IT IS PROVIDED IN THE HOPE THAT IT WILL BE USEFUL. HOWEVER, MARKPLEX CORPORATION ASSUMES NO LIABILITY FOR ANY DAMAGES, DIRECT OR OTHERWISE, RESULTING FROM THE USE OF THIS INFORMATION AND/OR PROGRAM(S) DESCRIBED, AND NO WARRANTY IS MADE REGARDING ITS ACCURACY OR COMPLETENESS. USE OF THIS INFORMATION AND/OR PROGRAMS DESCRIBED IS AT YOUR OWN RISK.
ANY EASYLANGUAGE OR POWERLANGUAGE TRADING STRATEGIES, SIGNALS, STUDIES, INDICATORS, SHOWME STUDIES, PAINTBAR STUDIES, PROBABILITYMAP STUDIES, ACTIVITYBAR STUDIES, FUNCTIONS (AND PARTS THEREOF) AND ASSOCIATED TECHNIQUES REFERRED TO, INCLUDED IN OR ATTACHED TO THIS TUTORIAL OR PROGRAM DESCRIPTION ARE EXAMPLES ONLY, AND HAVE BEEN INCLUDED SOLELY FOR EDUCATIONAL PURPOSES. MARKPLEX CORPORATION. DOES NOT RECOMMEND THAT YOU USE ANY SUCH TRADING STRATEGIES, SIGNALS, STUDIES, INDICATORS, SHOWME STUDIES, PAINTBAR STUDIES, PROBABILITYMAP STUDIES, ACTIVITYBAR STUDIES, FUNCTIONS (OR ANY PARTS THEREOF) OR TECHNIQUES. THE USE OF ANY SUCH TRADING STRATEGIES, SIGNALS, STUDIES, INDICATORS, SHOWME STUDIES, PAINTBAR STUDIES, PROBABILITYMAP STUDIES, ACTIVITYBAR STUDIES, FUNCTIONS AND TECHNIQUES DOES NOT GUARANTEE THAT YOU WILL MAKE PROFITS, INCREASE PROFITS, OR MINIMIZE LOSSES.