

A Gold Pass member requested a tutorial of how to create a TradeStation Radarscreen indicator that displays the following information based on the first bar of the day:
- Whether the bar was up or down
- High minus low (the range)
- High – low divided by the open (expressed as a percentage in RadarScreen)
- High minus low as a multiple of the ATR
- Gap value (open divided by the close of the previous bar, and the result minus 1, expressed as a percentage)
- Volume of the first bar of the day divided by the average daily volume (expressed as a percentage in RadarScreen)
The indicator will be applied to a 5 minute interval for stock symbols.
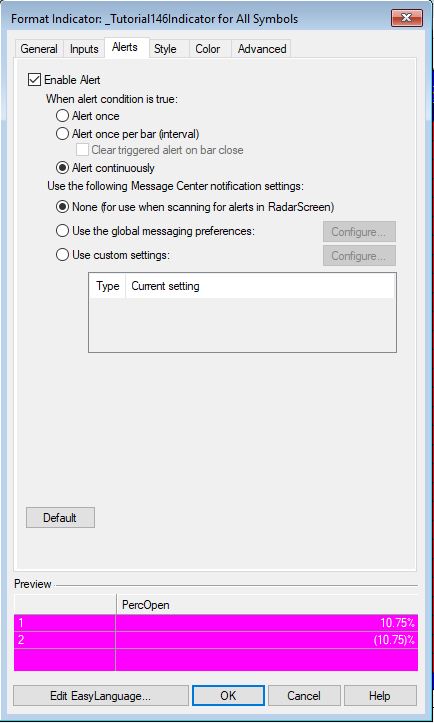
In the video below I explain how to sort the columns and sort by alerts.

How the tutorial 146 program works
The program counts how many completed days are loaded on the chart or on the radar screen. This is achieved by comparing the data of each bar by the date of the previous bar. If the date is different the day counter is incremented.
The main routine in the program is where all the various metrics are calculated. The day count is checked to make sure it is higher than the value of the DailyVolLength input. For the routine to run it also checks that it is the first bar of a new day. Some variables are reset and then the average daily volume is calculated using a loop. The loop goes back the required number of bars, incremented a variable with the volume of that bar, until the required number of days is reached.
After the total volume is calculated, the average daily volume is divided by the volume of the first bar.
The remainder of the calculations are very straighforward as are the plot and alert statements.
In the video I demonstrate how to sort the columns and keep them sorted. I also explain how to sort by an alert.
Inputs
Mult( 5 ), // Creates an alert when H – L is greater than this input
Length( 14 ), // The length of the average true range
DailyVolLength( 14 ); // Make sure you have at least this length of data,
// i.e. for 14 you need 14 days worth of minute bars
Download
Tutorial 146 is available for immediate download for $19.95. The download consists of an TradeStation ELD file that includes the unprotected and commented programs.
Radarscreen setup
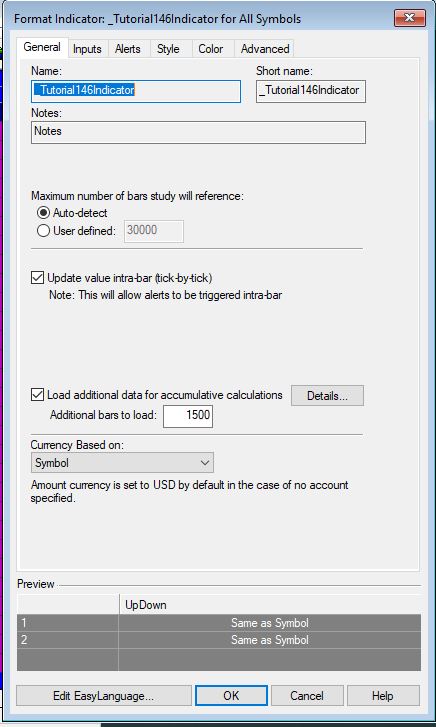
In the example given in the video Maximum number of bars study will reference is set to auto detect. Load additional data for cumulative calculations is set to 1,500. It is important to note that Radarscreen only loads the number of bars it thinks is necessary for calculations. In the case of this tutorial, this is insufficient so additional bars needed to be loaded using Load additional data for cumulative calculations.
Video demonstration
Please email if you find any bugs,notice any errors, or have questions about the tutorial.
THESE INDICATORS, SHOW ME STUDIES, STRATEGIES AND OTHER PROGRAMS HAVE BEEN INCLUDED SOLELY FOR EDUCATIONAL PURPOSES.
TO THE BEST OF MARKPLEX CORPORATION’S KNOWLEDGE, ALL OF THE INFORMATION ON THIS PAGE IS CORRECT, AND IT IS PROVIDED IN THE HOPE THAT IT WILL BE USEFUL. HOWEVER, MARKPLEX CORPORATION ASSUMES NO LIABILITY FOR ANY DAMAGES, DIRECT OR OTHERWISE, RESULTING FROM THE USE OF THIS INFORMATION AND/OR PROGRAM(S) DESCRIBED, AND NO WARRANTY IS MADE REGARDING ITS ACCURACY OR COMPLETENESS. USE OF THIS INFORMATION AND/OR PROGRAMS DESCRIBED IS AT YOUR OWN RISK.
ANY EASYLANGUAGE OR POWERLANGUAGE TRADING STRATEGIES, SIGNALS, STUDIES, INDICATORS, SHOWME STUDIES, PAINTBAR STUDIES, PROBABILITYMAP STUDIES, ACTIVITYBAR STUDIES, FUNCTIONS (AND PARTS THEREOF) AND ASSOCIATED TECHNIQUES REFERRED TO, INCLUDED IN OR ATTACHED TO THIS TUTORIAL OR PROGRAM DESCRIPTION ARE EXAMPLES ONLY, AND HAVE BEEN INCLUDED SOLELY FOR EDUCATIONAL PURPOSES. MARKPLEX CORPORATION. DOES NOT RECOMMEND THAT YOU USE ANY SUCH TRADING STRATEGIES, SIGNALS, STUDIES, INDICATORS, SHOWME STUDIES, PAINTBAR STUDIES, PROBABILITYMAP STUDIES, ACTIVITYBAR STUDIES, FUNCTIONS (OR ANY PARTS THEREOF) OR TECHNIQUES. THE USE OF ANY SUCH TRADING STRATEGIES, SIGNALS, STUDIES, INDICATORS, SHOWME STUDIES, PAINTBAR STUDIES, PROBABILITYMAP STUDIES, ACTIVITYBAR STUDIES, FUNCTIONS AND TECHNIQUES DOES NOT GUARANTEE THAT YOU WILL MAKE PROFITS, INCREASE PROFITS, OR MINIMIZE LOSSES.