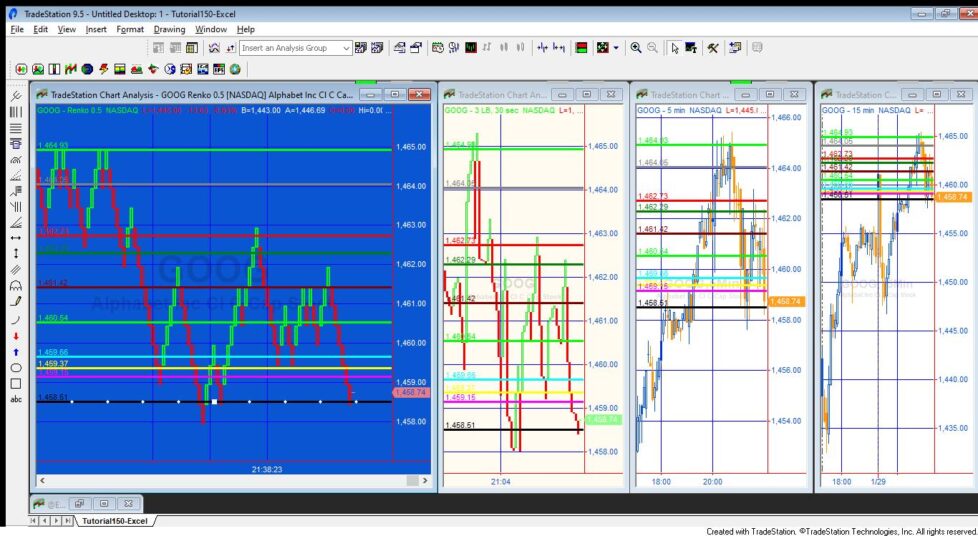
Tutorial 150 demonstrates how to create TradeStation EasyLanguage programs to share data from one chart to another (or others). The ‘sender’ program draws horizontal lines at various price levels and stores the price levels of the lines in a Excel spreadsheet. A ‘receiver’ program reads the values from the Excel spreadsheet and draws corresponding horizontal lines on another chart.
The functionality is similar to that found in Program 35 | XML version (see https://markplex.com/easylanguage-programs/program-35-xml-version/) except with tutorial 150 the data is stored in an Excel spreadsheet rather than an XML (Extensible Markup Language) file.
When you change the UniqueName or spreadsheet filename/location an error may occur which will turn the status of the programs to off. Simply reactivate the programs (turn the status to on) after the change. Reactivate the sender program (_Tutorial150-Excel) first followed by the receiver programs (_Tutorial150-Excel-Read).
In the tutorial data is stored in the Excel spreadsheet corresponding to the FileName input. To enable more than one dataset to the stored in the same spreadsheet the data in the first column is set to the value of the UniqueName string. When the sending program (_Tutorial150-Excel) is applied to the chart it searched through the sheet called FileName looking for a row of data with the UniqueName in the first column. If UniqueName is not found, data levels are calculated and the UniqueName and data are added to the chart. If a row with UniqueName in the first column is found, the levels data is read into the program.

The initial horizontal line positions are calculated by finding difference between highest and lowest prices on the visible chart and dividing by NumberSR. A For loop is then used to calculated the individual levels as in the following code excerpt:
Const: int NumberSR( 10 ); // The number of horizontal lines to draw on chart

Vars: double HighestVisible( GetAppInfo( aiHighestDispValue ) ), // Highest visible price on the chart
double LowestVisible( GetAppInfo( aiLowestDispValue ) ), // Lowest visible price on the chart
double diff( ( HighestVisible - LowestVisible ) / NumberSR ), // Stores the price difference between the highest and lowest displayed values

int Ctr( 0 ),
double LineVal( 0 ),
.
.
.
.;

For Ctr = 0 to NumberSR - 1
Begin
// Calculate the initial level for each line
LineVal = LowestVisible + ( Ctr ) * Diff;
.
.
.
.
End;
- Writing to and reading from a Excel Workbook object
- Reading and writing to vectors
- Using the Chartinghost and drawing objects to determine when a horizontal line is clicked and moved
- Using the timer class
Detecting when a horizontal line is moved in the sending program
When the horizontal line are created they are given a click event. This tells the program when a down click occurs to a line (required to manually move the line). On this event the line is stored into a temporary line object. However the click event does not tell us when the line is up-clicked. For this the ChartingHost object is used. When it is created it is given a click event. When the mouse is released (up-click) this click event is fired. From this the program can discern the new price level. The program, having already stored the line on which a down-click was made, searches through all the lines to determine which line was moved. The new price level is stored in the spreadsheet.
How does the receiving program detect when a change has been made to the spreadsheet
The receiving program needs to update the position of the lines on the receiving chart when the data in the spreadsheet changes. But how does the receiving program know that the data has changed? Unfortunately the workbook class does not provide an update event so the receiving program uses a timer to scan the spreadsheet at a user defined interval to see if any changes have occurred. The interval is set by the user input: lineMoveInt, specified in milliseconds. This is set to 5,000 by default, i.e. 5 seconds. Unfortunately this process is resource hungry and so it is best to make this number as big as possible.
Video demonstration of tutorial 150 (sender program)
Video demonstration of tutorial 150 (receiver program)
Please email if you find any bugs, notice any errors, or have questions about the tutorial.
THESE INDICATORS, SHOW ME STUDIES, STRATEGIES AND OTHER PROGRAMS HAVE BEEN INCLUDED SOLELY FOR EDUCATIONAL PURPOSES.
TO THE BEST OF MARKPLEX CORPORATION’S KNOWLEDGE, ALL OF THE INFORMATION ON THIS PAGE IS CORRECT, AND IT IS PROVIDED IN THE HOPE THAT IT WILL BE USEFUL. HOWEVER, MARKPLEX CORPORATION ASSUMES NO LIABILITY FOR ANY DAMAGES, DIRECT OR OTHERWISE, RESULTING FROM THE USE OF THIS INFORMATION AND/OR PROGRAM(S) DESCRIBED, AND NO WARRANTY IS MADE REGARDING ITS ACCURACY OR COMPLETENESS. USE OF THIS INFORMATION AND/OR PROGRAMS DESCRIBED IS AT YOUR OWN RISK.
ANY EASYLANGUAGE OR POWERLANGUAGE TRADING STRATEGIES, SIGNALS, STUDIES, INDICATORS, SHOWME STUDIES, PAINTBAR STUDIES, PROBABILITYMAP STUDIES, ACTIVITYBAR STUDIES, FUNCTIONS (AND PARTS THEREOF) AND ASSOCIATED TECHNIQUES REFERRED TO, INCLUDED IN OR ATTACHED TO THIS TUTORIAL OR PROGRAM DESCRIPTION ARE EXAMPLES ONLY, AND HAVE BEEN INCLUDED SOLELY FOR EDUCATIONAL PURPOSES. MARKPLEX CORPORATION. DOES NOT RECOMMEND THAT YOU USE ANY SUCH TRADING STRATEGIES, SIGNALS, STUDIES, INDICATORS, SHOWME STUDIES, PAINTBAR STUDIES, PROBABILITYMAP STUDIES, ACTIVITYBAR STUDIES, FUNCTIONS (OR ANY PARTS THEREOF) OR TECHNIQUES. THE USE OF ANY SUCH TRADING STRATEGIES, SIGNALS, STUDIES, INDICATORS, SHOWME STUDIES, PAINTBAR STUDIES, PROBABILITYMAP STUDIES, ACTIVITYBAR STUDIES, FUNCTIONS AND TECHNIQUES DOES NOT GUARANTEE THAT YOU WILL MAKE PROFITS, INCREASE PROFITS, OR MINIMIZE LOSSES.

